Guide
What the DeepTicker Score is and how a stock’s quality is calculated
The DeepTicker Score is a 0-to-100 score that sums up the fundamental quality of a listed company. It combines five dimensions: Value, Growth, Track record, Profitability and Solvency, to help you answer one key question at a glance: how good is this business by its numbers?
The higher the score, the more solid the business looks according to its fundamentals. The lower it is, the more signs of weakness appear across several dimensions: weak profitability, soft growth, high debt, unstable margins or inconsistent earnings.
Important from the start: the DeepTicker Score is not a buy recommendation nor a prediction of returns. A company can have an excellent score and still trade at a demanding price. That is why it is always worth crossing quality with valuation, multiples, sector, market context and your own judgment.
If you are just starting out, you can start a free trial and explore the Stock Screener to see the score in action.
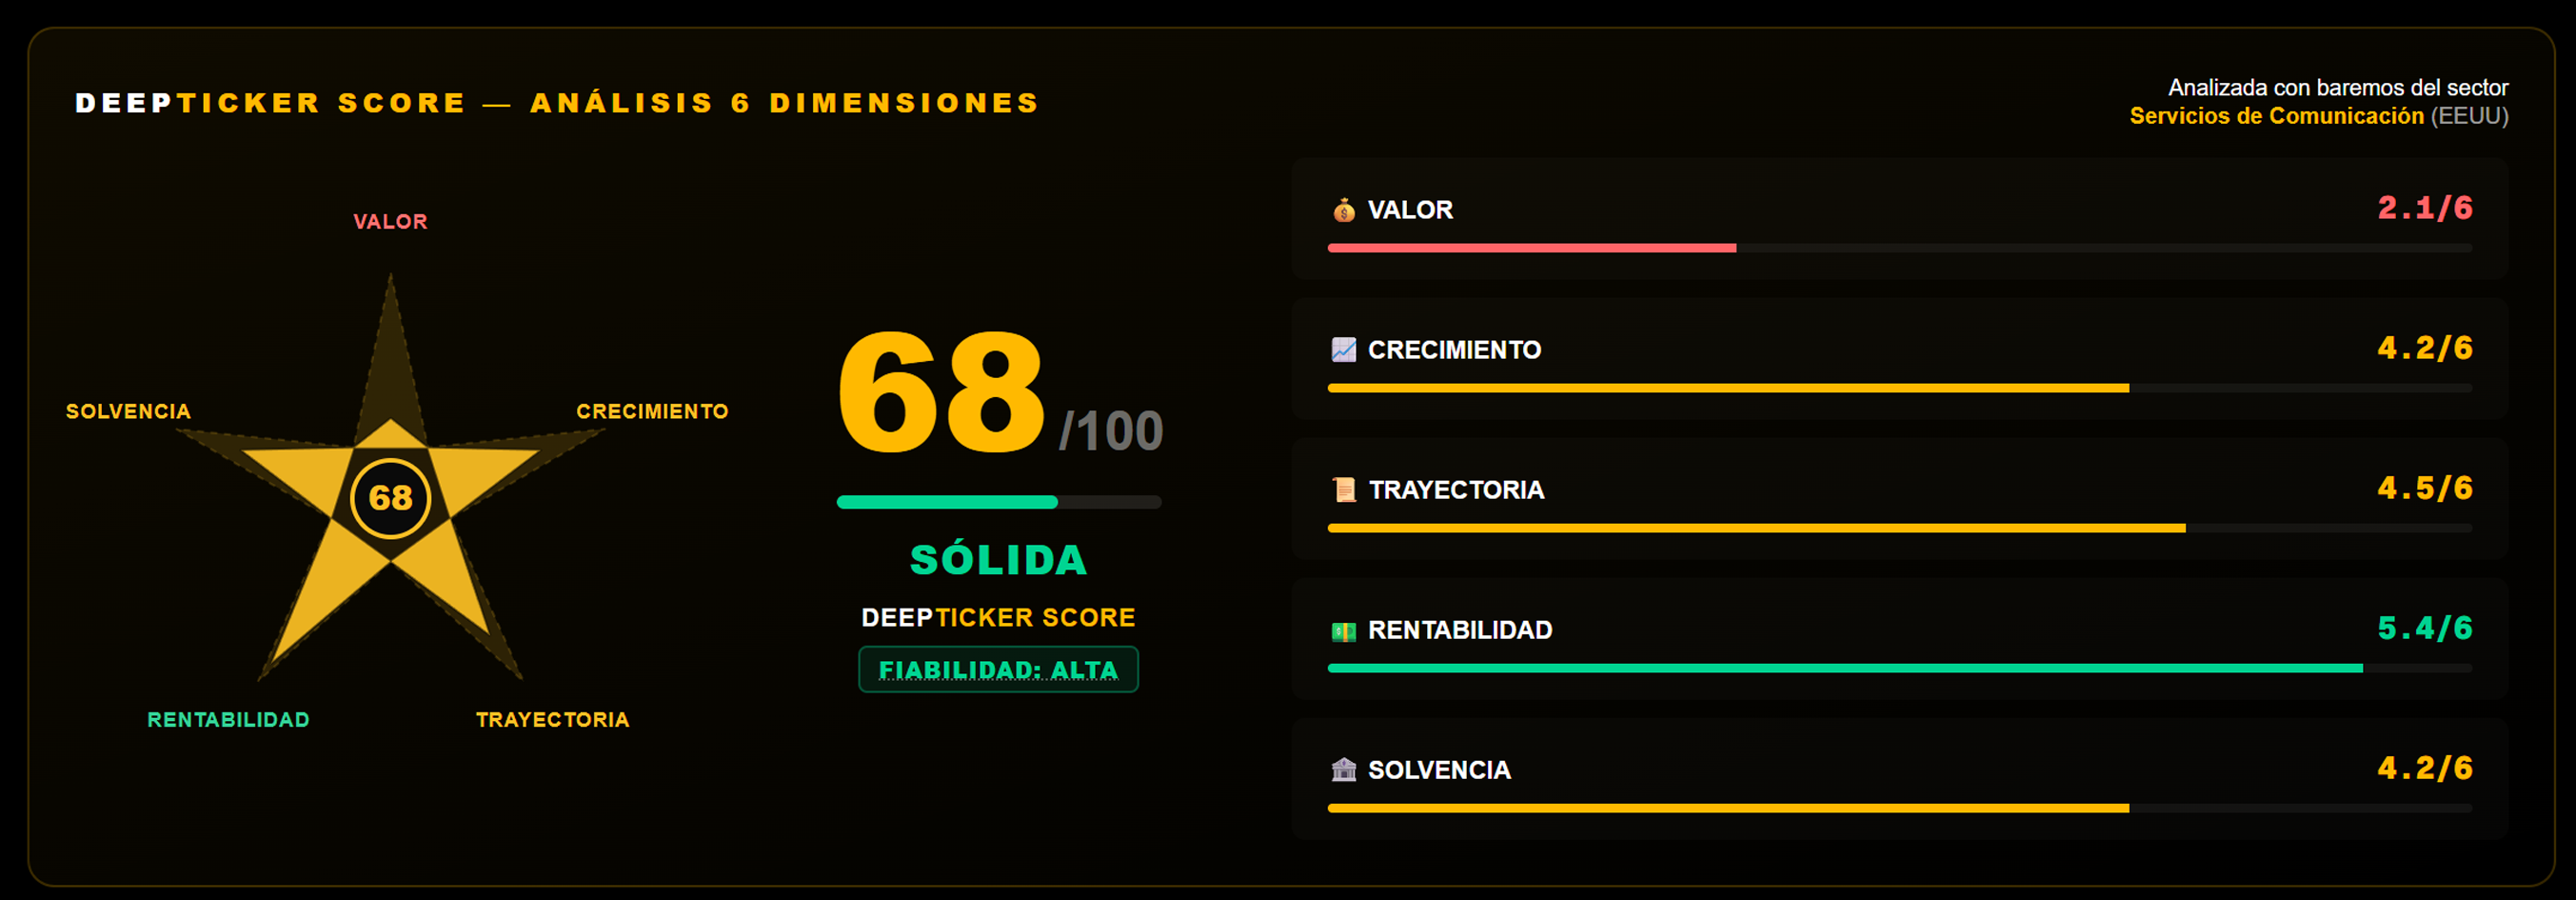
The five dimensions of the DeepTicker Score
The quality of a company cannot be summed up in a single ratio. That is why DeepTicker scores each company across five complementary dimensions and then combines them into a single 0-to-100 score.
That way, a company with brilliant margins but a fragile balance sheet does not show up as excellent with no caveats: solvency carries weight. And a company that is cheap on multiples, but with unstable earnings and mediocre profitability, does not slip through as a great opportunity just because it looks cheap.
These are the five dimensions:
Value
Looks at whether the valuation seems reasonable against earnings, sales, cash flow and enterprise value. It includes metrics such as P/E, P/Sales, P/FCF or EV/EBITDA. It helps you tell whether the price looks demanding, reasonable or potentially discounted versus comparable companies, but it does not turn the score into a buy recommendation.
Growth
Measures whether the company is increasing sales and earnings in a sustained way. It takes into account historical growth, EPS, sales, year-over-year trends and future estimates when they are available.
Track record
Assesses how consistent the business has been over time: years of positive earnings, margin stability, the trajectory of results and the ability to avoid extreme swings.
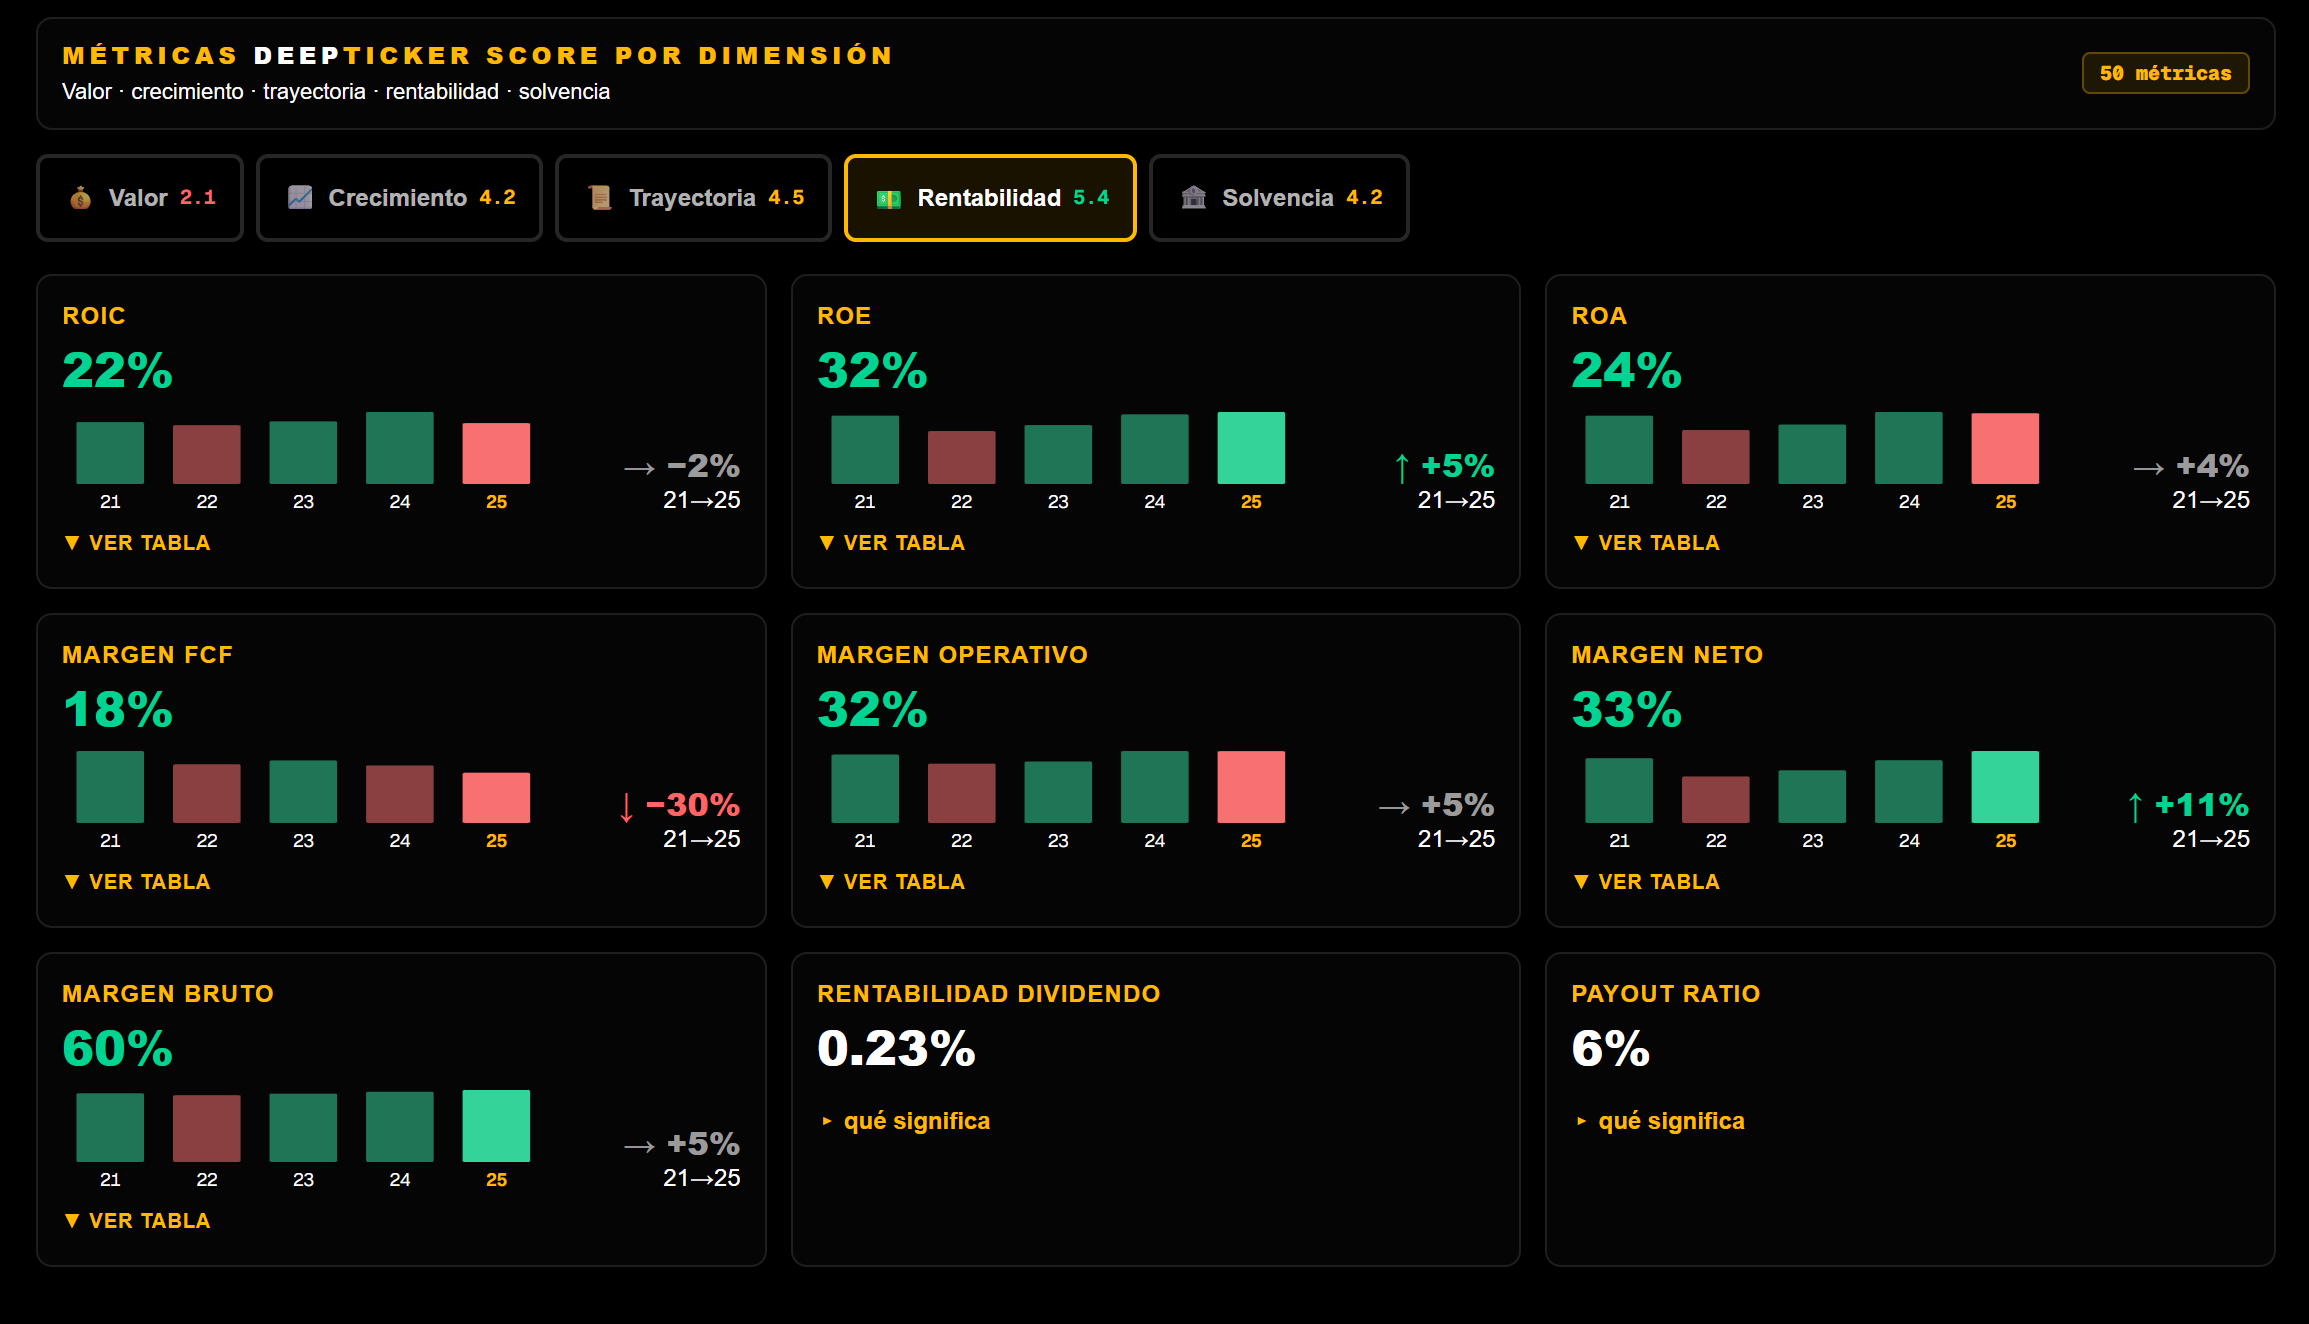
Profitability
Measures whether the company generates good returns on the capital it uses. It includes ROIC, ROE, ROA, operating margin, net margin and free cash flow margin. ROIC is one of the most important metrics in the model, because it helps identify businesses that turn capital into profit efficiently.
Solvency
Assesses whether the balance sheet holds up. It takes into account net debt to EBITDA, liquidity, interest coverage, debt to equity and other signs of financial strength.
How to read the number
High-quality company across most dimensions. It does not mean “buy now”: a great company can be expensive.
Good overall quality, though with some room for improvement. It may fall short on valuation, growth, solvency or track record.
Mixed profile. It needs a case-by-case analysis, because the weak points weigh as much as the strong ones.
Signs of structural weakness across several dimensions. It would only make sense to study it if you believe something relevant could change.
A reading example of the DeepTicker Score
Imagine two companies.
The first one has a DeepTicker Score of 88. It shows high profitability, ROIC well above its cost of capital, stable margins, a healthy balance sheet and consistent earnings. Its weakest point is valuation: it trades on demanding multiples.
Reading: the business looks very high quality, but the price may already price in much of that quality. The score invites you to study it; the valuation tells you to look closely.
The second company has a score of 42. It looks cheap on multiples, but its profitability is mediocre, debt is high and earnings are irregular.
Reading: cheap can be a value trap. The score warns that the discount could be justified by a deteriorating business.
The practical takeaway is always the same: cross quality with price. A high score tells you the business has good numbers; valuation and context help you decide whether the price makes sense.
Score reliability: High, Medium or Low
Not all scores have the same reliability. DeepTicker shows it explicitly on each company’s profile.
High
Complete data, compared against the ticker’s specific industry. The score discriminates quality well within its comparable group.
Medium
Some relevant data is missing, or the benchmark is built on a broader sector. The score is still useful, but it should be read with more caution.
Low
Important dimensions are missing or there is not enough sector benchmark. The score is only indicative and should not be used as a main analysis signal.
When reliability is medium or low, DeepTicker shows it so you do not mistake a score that is weak for lack of data for a strong conclusion about the business.
Special cases: when the same rules do not apply
Not every company is analyzed the same way. A bank, an insurer, a REIT or a cyclical company should not be measured by exactly the same rules as a tech company, an industrial or a stable consumer business.
REITs
ROE can be distorted by the accounting depreciation of properties. DeepTicker shows it, but does not read it the same way as in a traditional company. In these cases, metrics such as FFO and AFFO carry more weight.
Banks
High debt is part of the business model, so it is not penalized the same way as in an industrial company. DeepTicker uses metrics that are more appropriate for banks, such as net interest margin, efficiency and capital ratios.
Insurers
They are analyzed with specific metrics such as combined ratio, return on capital, consistency of results and balance sheet quality.
Asset managers, exchanges and payments
Companies such as Visa, Mastercard, BlackRock or similar are handled with a policy adapted to their business model, combining profitability, margins, growth, solvency and stability.
Chronically loss-making companies
If a company has gone years without profits, the P/E stops being useful. In those cases DeepTicker pays more attention to cash, solvency, dilution, growth and the ability to survive.
Cyclical companies
In sectors such as energy, mining, autos or commodities, the P/E can mislead at the peaks or troughs of the cycle. DeepTicker flags these cases so you do not read the multiple in isolation.
Moat profile: Quality Premium
When a company meets several demanding criteria at once, DeepTicker can flag it with a 🏆 Moat profile or Quality Premium badge. It tends to appear in companies with:
- →High and sustained return on capital.
- →High and stable margins.
- →Positive revenue growth.
- →A healthy balance sheet and debt under control.
- →Consistent earnings over time.
This badge does not guarantee that a company has a real economic moat. It is a financial proxy: it indicates that its numbers are compatible with a business that is hard to replicate or with sustainable competitive advantages.
Companies such as Visa, Costco or LVMH may fit this kind of profile, but the badge does not replace qualitative analysis. It only signals that the fundamentals show traits of superior quality.
What the DeepTicker Score does not tell you
The DeepTicker Score is a useful tool, but it should not be read as a complete answer. There are several things it does not set out to do:
- ✕It does not tell you whether you should buy or sell a stock.
- ✕It does not predict future returns.
- ✕It does not replace your own judgment or strategy.
- ✕It does not work equally well for companies with very little history.
- ✕It does not remove the need to look at valuation, news, risks and context.
- ✕It does not turn an excellent company into a good investment if the price is too demanding.
The DeepTicker Score measures fundamental quality. To analyze an investment, you have to cross that quality with price, expectations, risks, time horizon and market context.
What it is based on
The DeepTicker Score starts from a simple idea: a company should be compared with similar businesses, not against the whole market as one block.
A 12% margin can be excellent in retail and mediocre in software. High debt can be normal in a bank and worrying in an industrial company. That is why DeepTicker compares the metrics against the quartiles of its own industry whenever the data allows it.
The model combines metrics of valuation, growth, track record, profitability and solvency. The methodology, the weights and the special-handling rules are DeepTicker’s own. The raw data comes from financial providers and market sources, and is processed to deliver consistent, up-to-date and easy-to-read information.
Where to see the DeepTicker Score
The DeepTicker Score appears on each company’s profile, alongside its dimensions, reliability, key metrics, valuation, risks and context.
You can also use it inside the Stock Screener to filter companies by overall quality or by specific dimensions. For example, you can search for companies with high profitability, good solvency, consistent growth or a balanced combination of factors.
You can start a free trial to explore company profiles and the screener, or sign in if you already have an account.
Frequently asked questions about the DeepTicker Score
What is the DeepTicker Score?
The DeepTicker Score is a 0–100 score that sums up the fundamental quality of a listed company. It combines five dimensions: Value, Growth, Track record, Profitability and Solvency. It is meant to help you understand the quality of the business, not to automatically decide whether a stock should be bought or sold.
What does each of the five dimensions measure?
Value looks at whether the valuation seems reasonable against earnings, sales and cash. Growth measures the trend in sales and earnings. Track record looks at historical consistency. Profitability analyzes ROIC, ROE, ROA and margins. Solvency assesses debt, liquidity and balance sheet strength.
Does a high DeepTicker Score mean buy?
No. A high score indicates that the business has good fundamentals according to the DeepTicker model, but an excellent company can be expensive. To make a decision you also need to look at valuation, multiples versus the sector, risks, news, expectations and your own investment horizon.
How is the DeepTicker Score different from a P/E?
The P/E is a single valuation multiple. The DeepTicker Score is a composite score that integrates several dimensions: valuation, growth, track record, profitability and solvency. The P/E helps you understand how much you pay for the earnings; the score helps you gauge the quality of the business by its numbers.
Why does DeepTicker compare by industry?
Because each sector works by different rules. A margin, a level of debt or a return on capital does not mean the same thing in software, banking, retail, energy or healthcare. Comparing each company with its own industry makes the analysis fairer and more useful.
Is the DeepTicker Score financial advice?
No. The DeepTicker Score is a quantitative analysis and financial education tool. It does not offer personalized investment recommendations. Investment decisions and their consequences are the sole responsibility of the user.