Before you open your broker
The global market in 30 seconds. With the reading already prepared.
A market dashboardwith 678 curated assets on a single screen: indices, the full S&P 500, 104 thematic ETFs, IBEX, Europe, commodities and crypto.
DeepTicker cross-checks that data to capture the pulse of the session: whether risk appetite, caution or fear is leading; which sectors are out front; which assets are setting the tone for the day; and which signals are worth watching.
Designed to be the first thing you open each morning, before you look at individual stocks or log in to your broker.
Start 14-day free trialWhat it is
See the state of the market in 30 seconds
The state of the market answers a simple question: what is happening today and how can it affect my decisions?
DeepTicker’s Market Dashboardsums it up without you having to build dashboards or configure widgets: 12 key indicators, an S&P 500 map, sectors, ETFs, market breadth, news, upcoming events and a clear regime: risk appetite, caution or risk aversion.
If you just want a quick look, you can check the stock market today in the public version. And if you want to dig deeper, open any company profile in the stock screener, see how it scores with the DeepTicker Score or follow your positions in My Portfolio.
What’s inside
Ten blocks. Zero setup.
Open it and it’s all laid out: no dashboards to build, no widgets to choose. The dashboard is designed to help you understand the context of the session before you analyze specific stocks.
Market pulse
12 key indicators at a glance: S&P 500, Nasdaq, Dow, IBEX 35, Euro Stoxx, the VIX with a traffic-light gauge, the US 10-year yield, EUR/USD, gold, oil, Bitcoin and Ethereum. Each indicator comes with a short note on what it means and why it can matter.
DeepTicker market readings
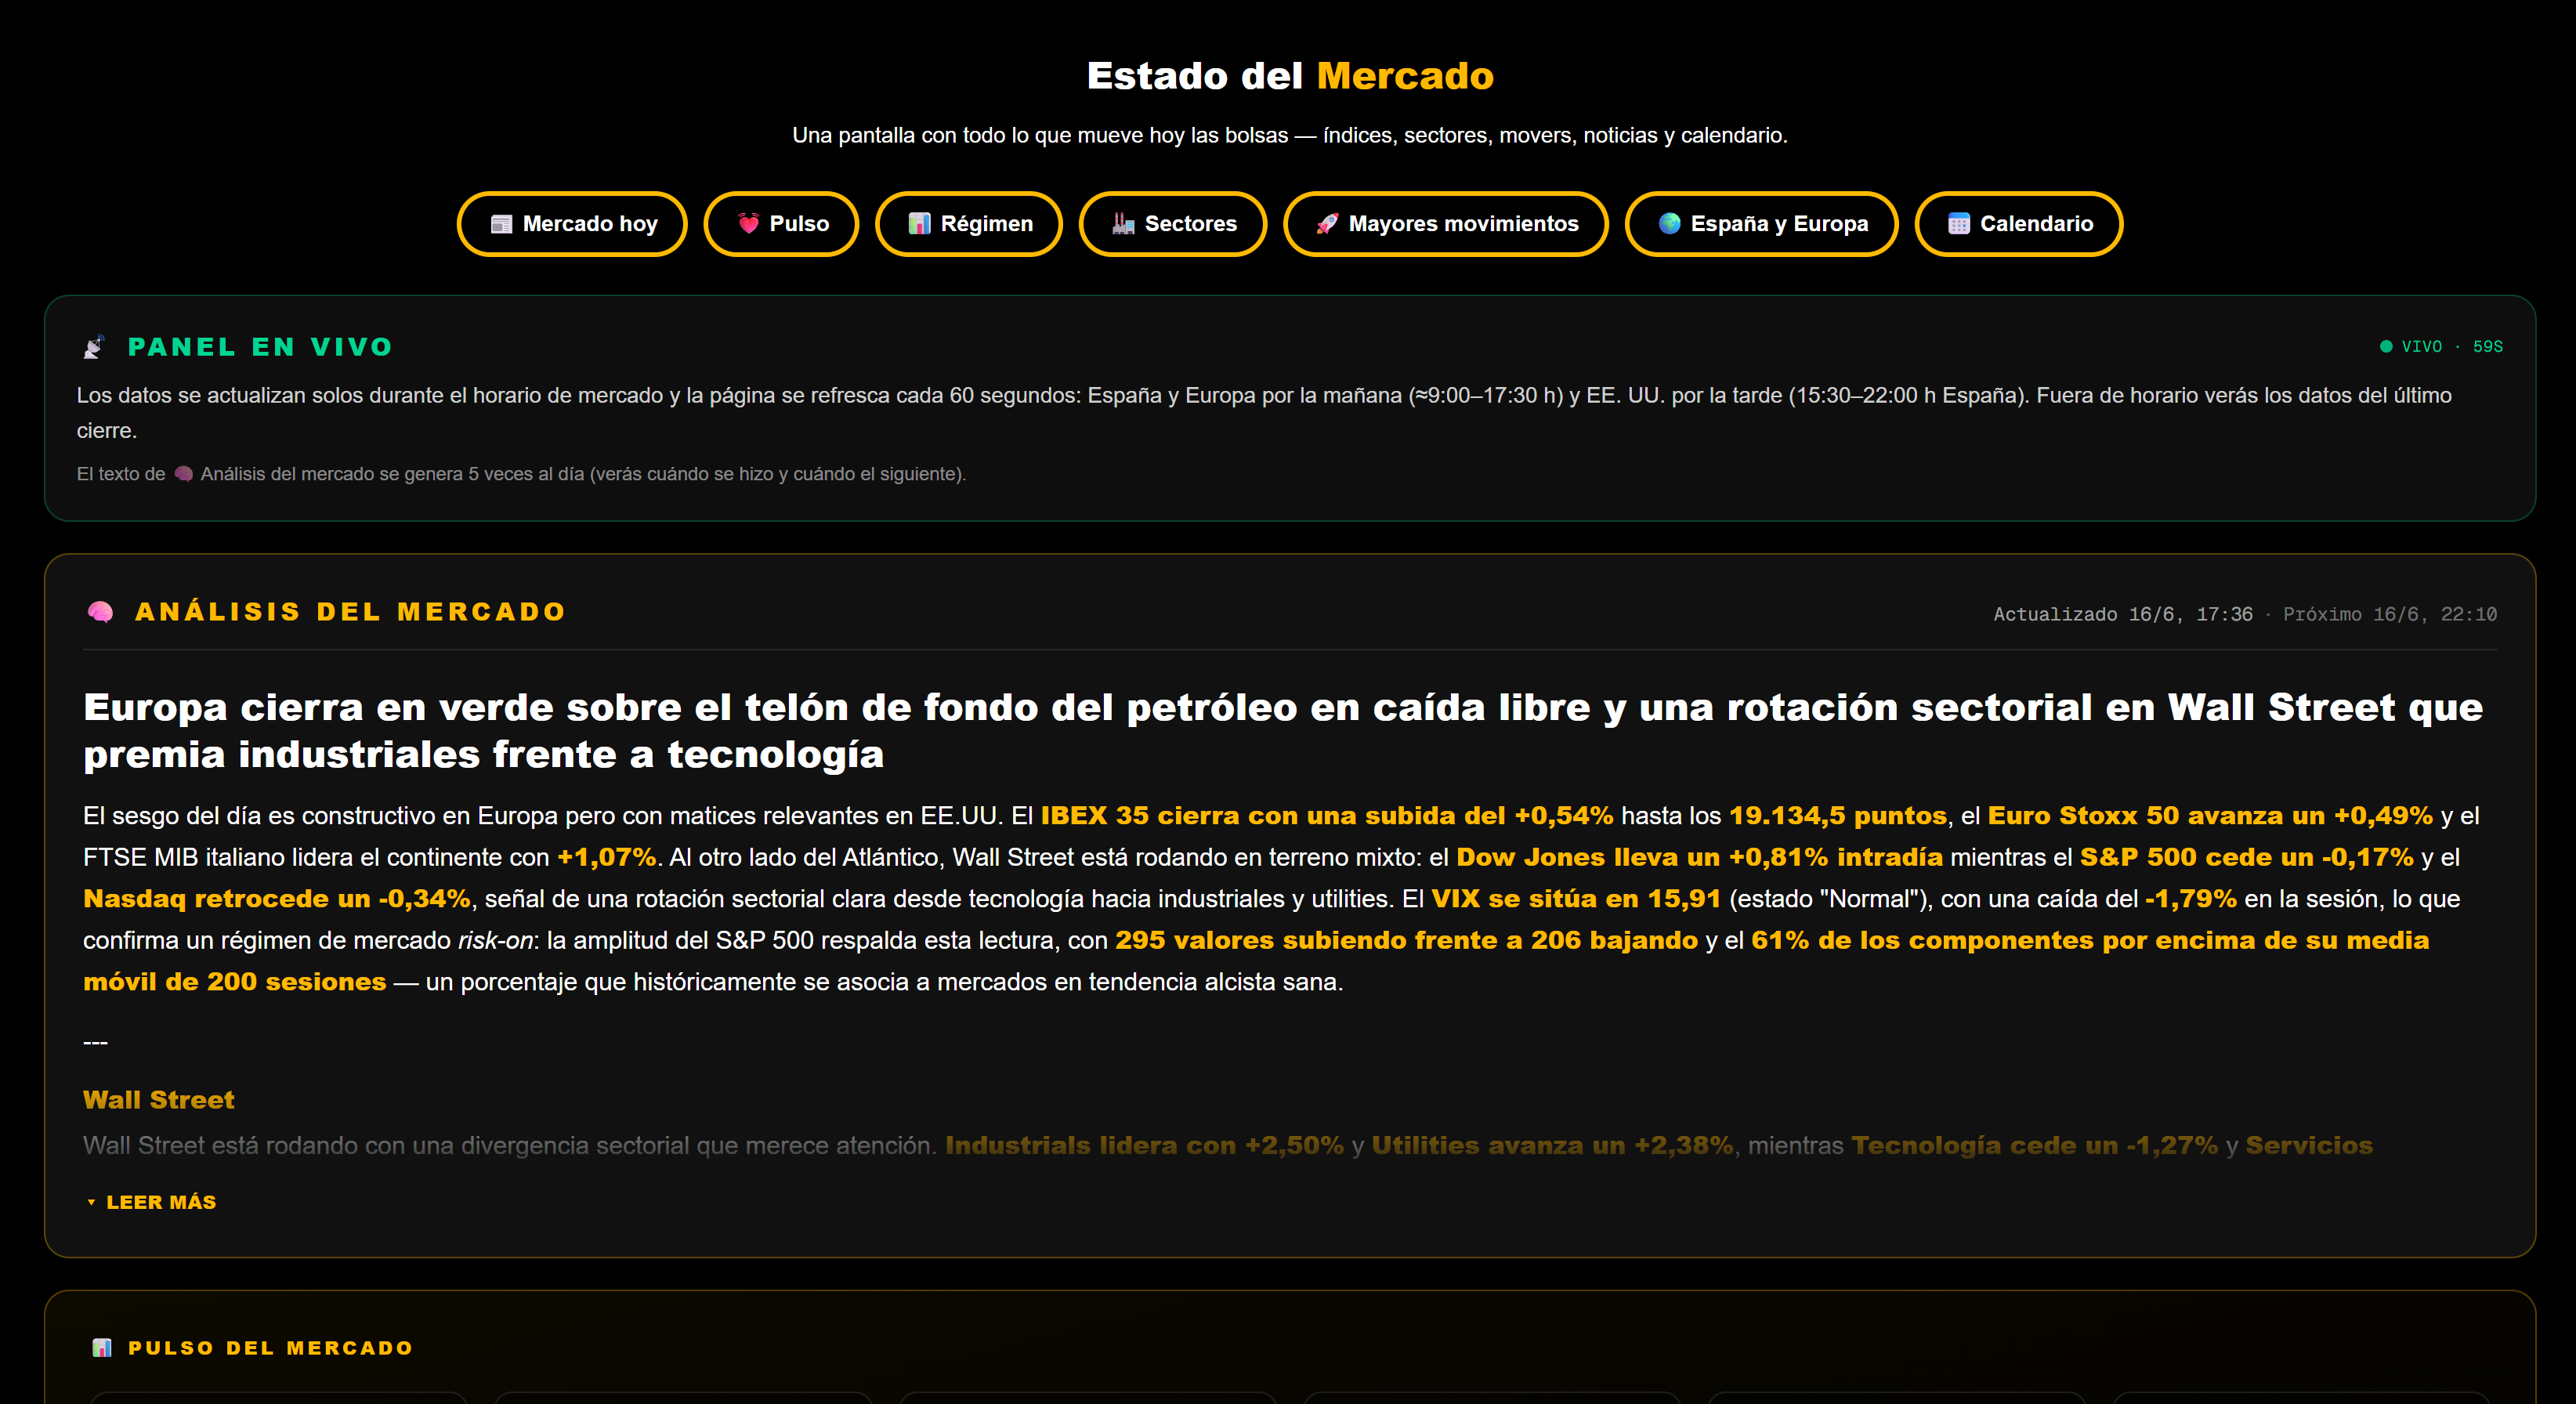
Five times a day, DeepTicker publishes a structured reading of the session: the European open, the Wall Street open, mid-session, the European close and the US close. Each reading sums up what is moving, which sectors are leading, which assets weigh most on the day and which signals are worth watching.
Breadth and regime
DeepTicker tells you whether the market is in risk-appetite, caution or risk-aversion mode. To work it out, it combines the VIX, stocks rising versus falling, the percentage of the S&P 500 above its 50- and 200-day averages and sector leadership. Always with an explanation of the why.
Trending on DeepTicker
The 20 most-viewed stocks across the community over the last 7 days. Our own signal for spotting which companies are drawing the most interest inside DeepTicker.
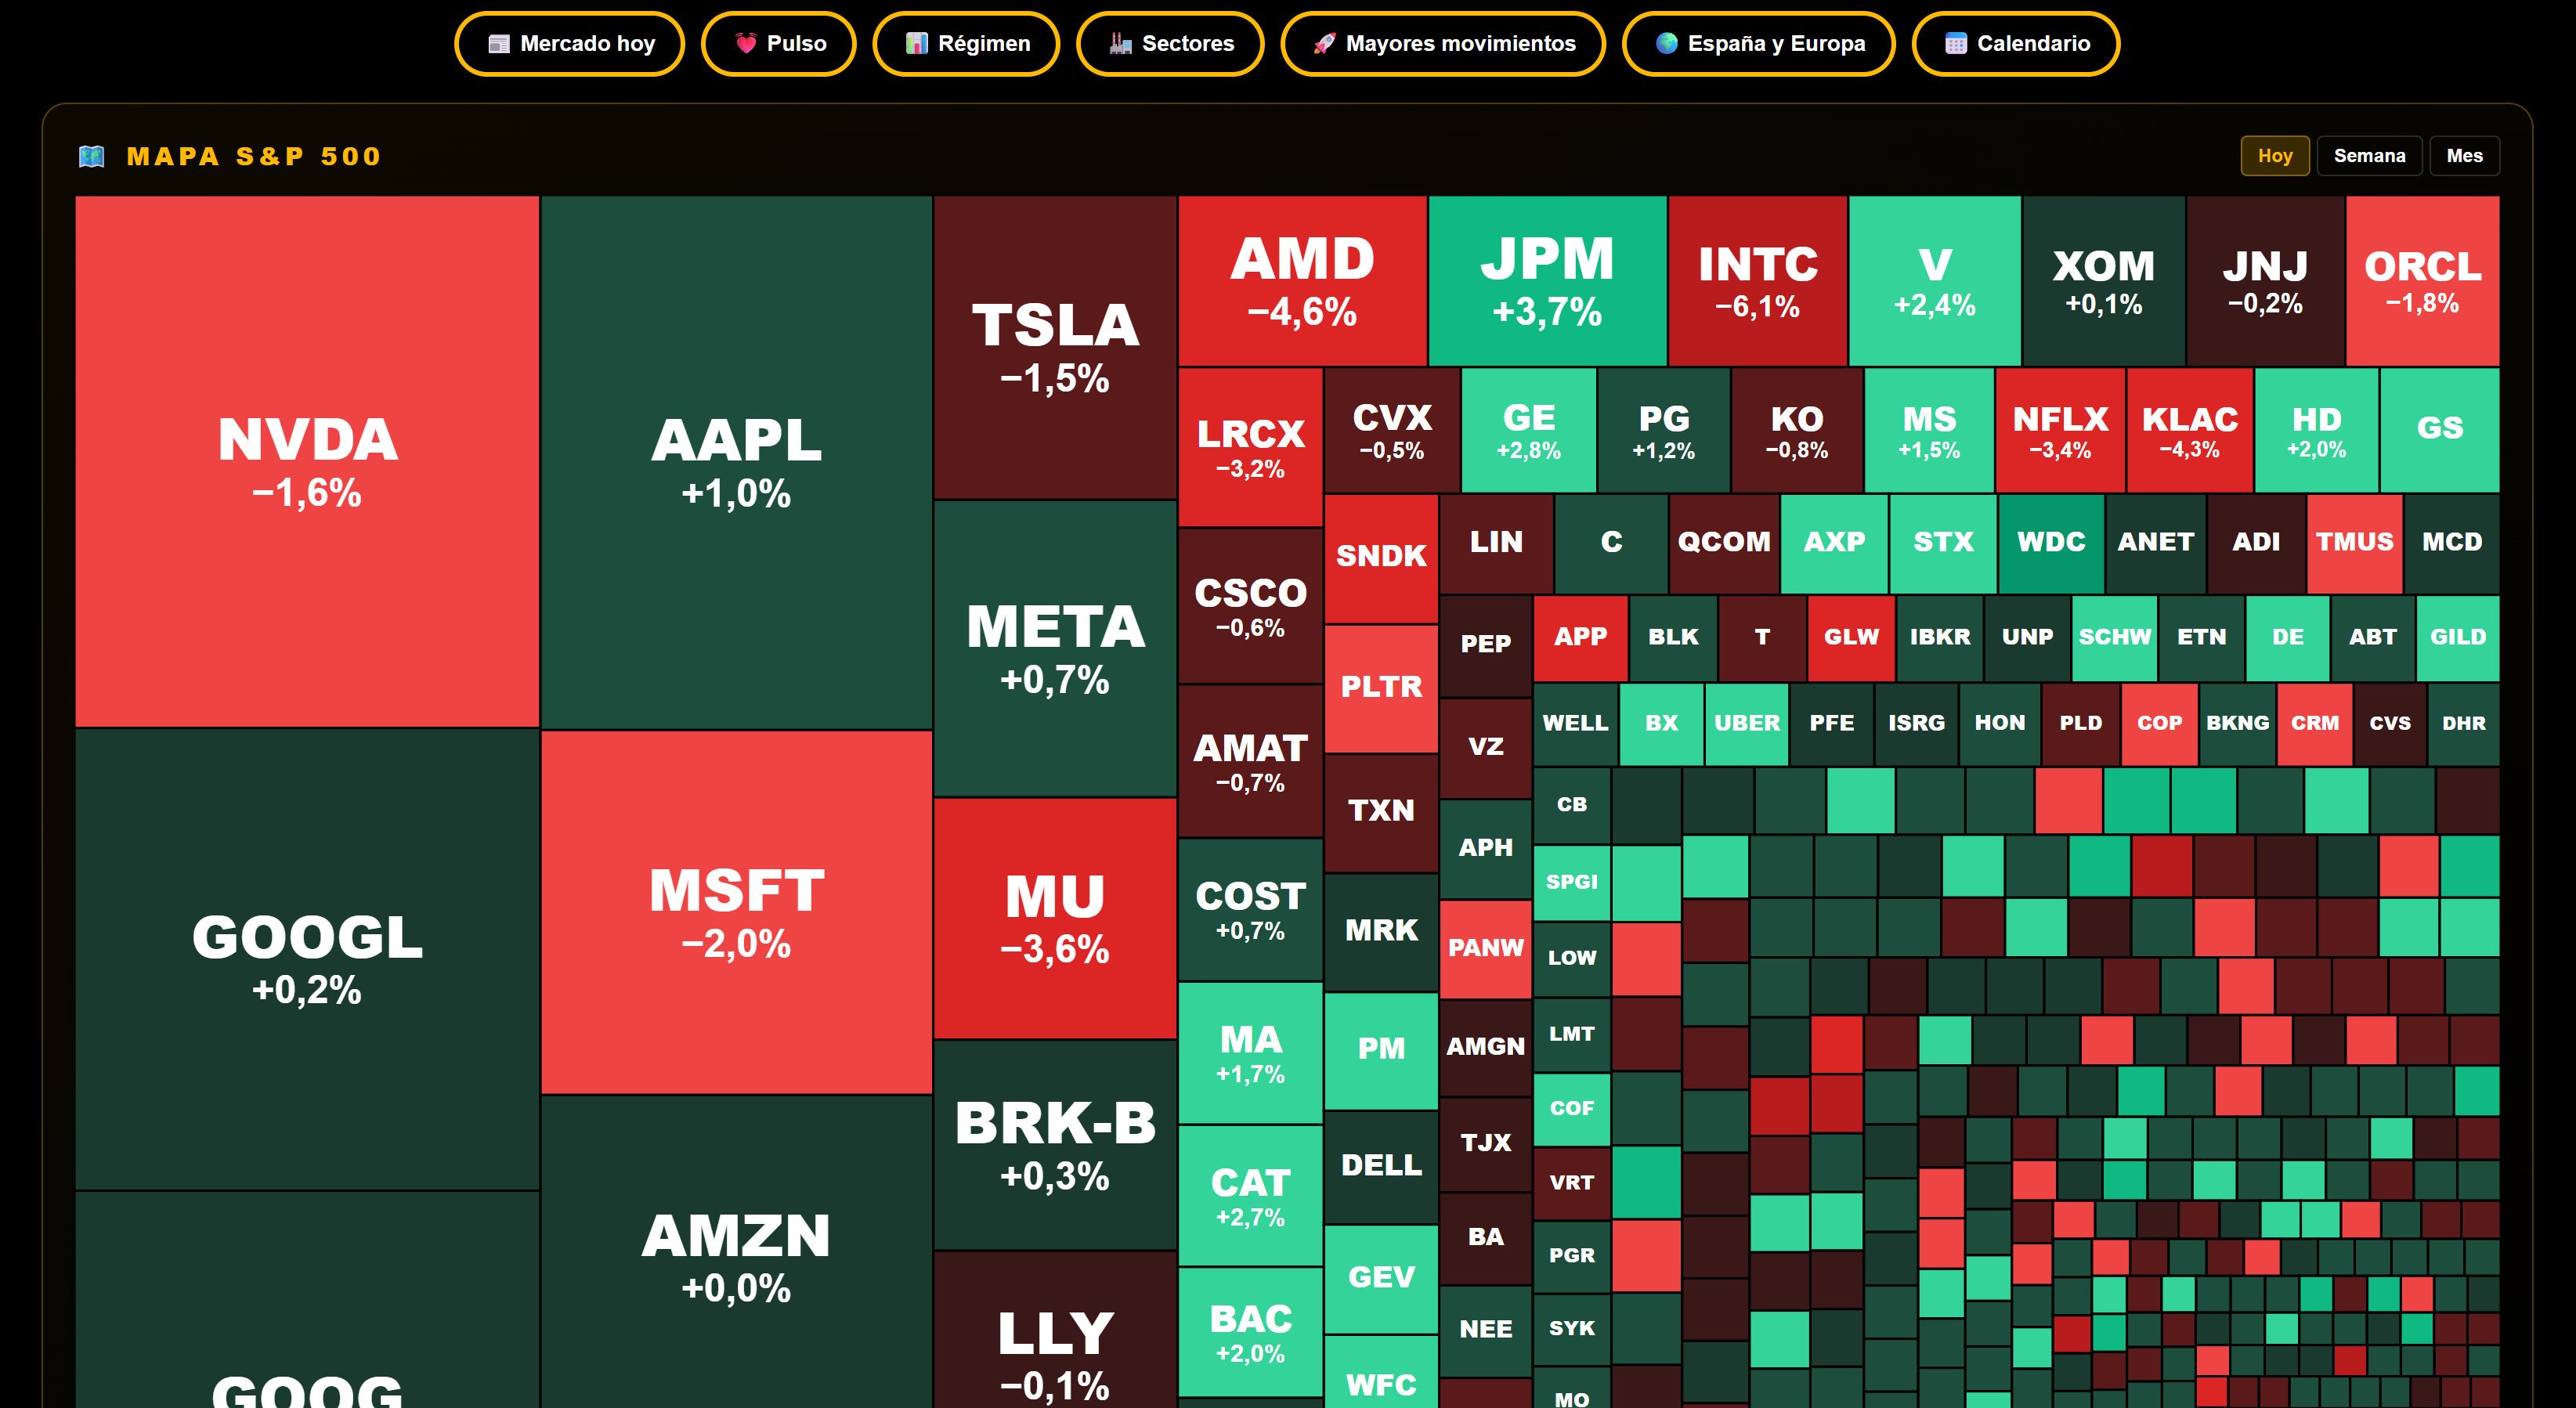
S&P 500 map
The full S&P 500 in a treemap sized by weight and colored by performance. You can switch between day, week and month and drill down by sector and industry.
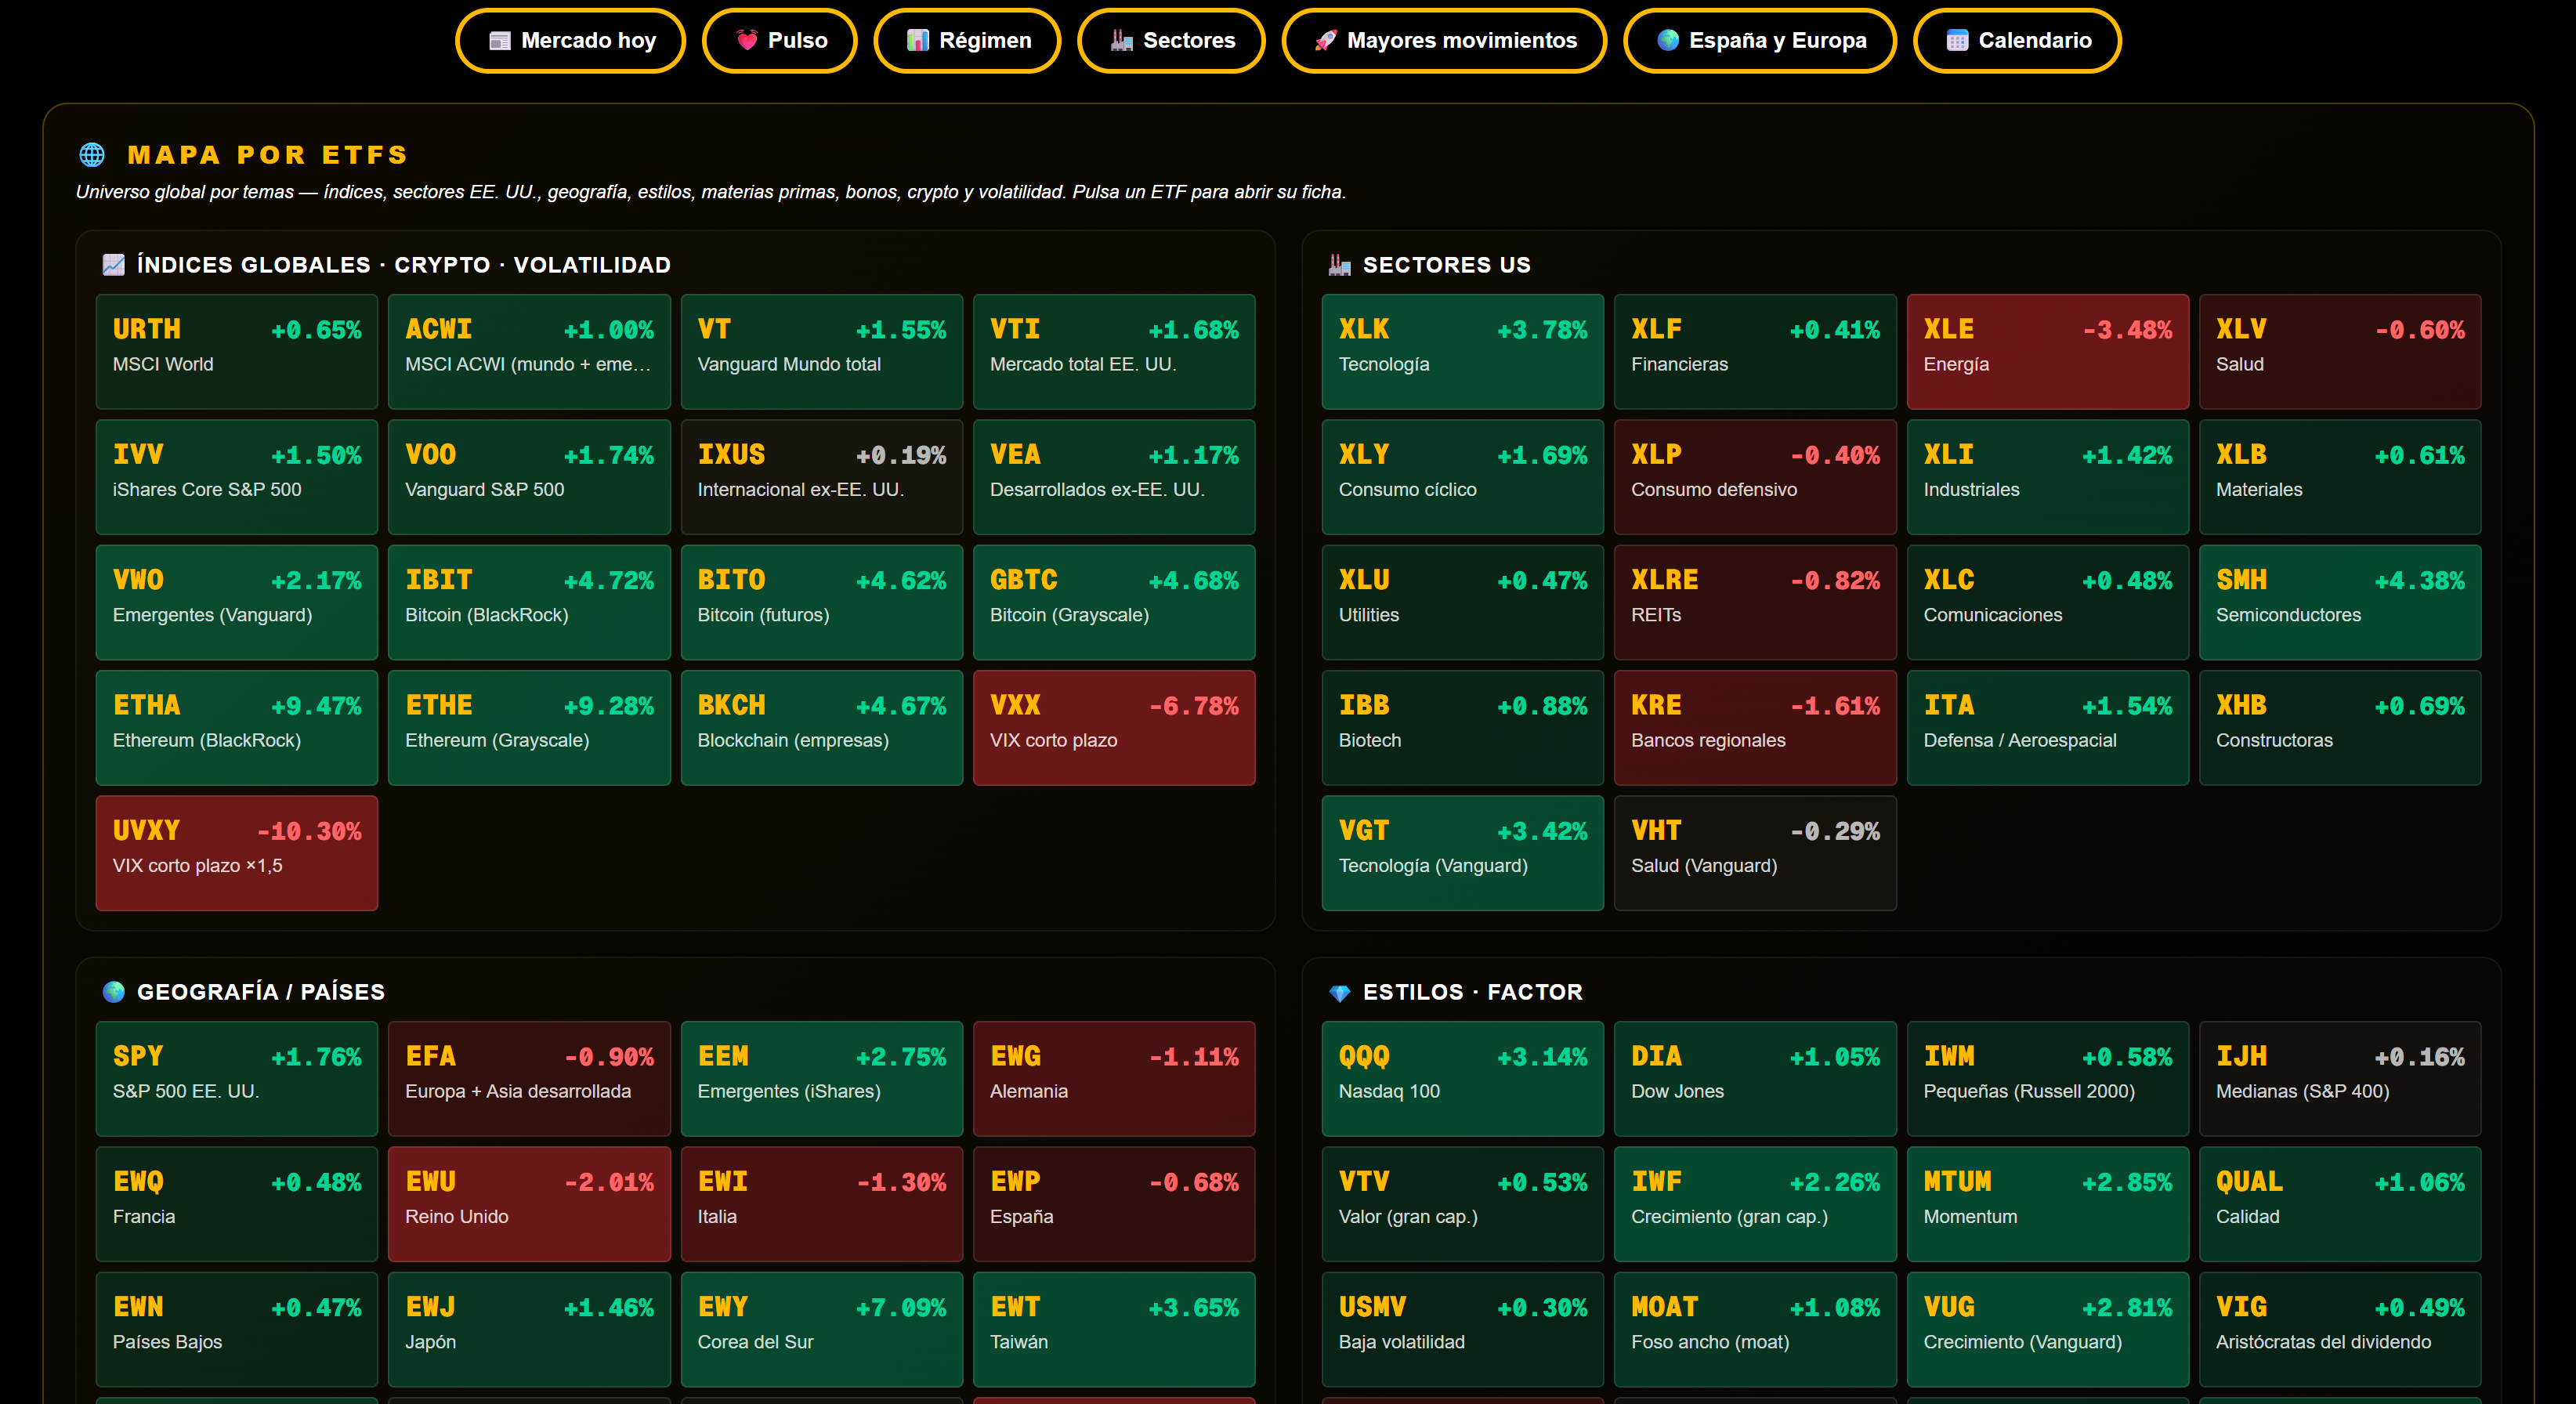
ETF map
104 curated ETFs in 6 thematic blocks: global indices and crypto, US sectors, countries, investment styles, commodities and bonds. It helps you see whether the market is rotating into technology, gold, fixed income, commodities, specific countries or defensive plays.
Top gainers and losers
The top 10 gainers and losers, with the headline of the day that helps explain the move. From any stock you can open its full profile without leaving the page.
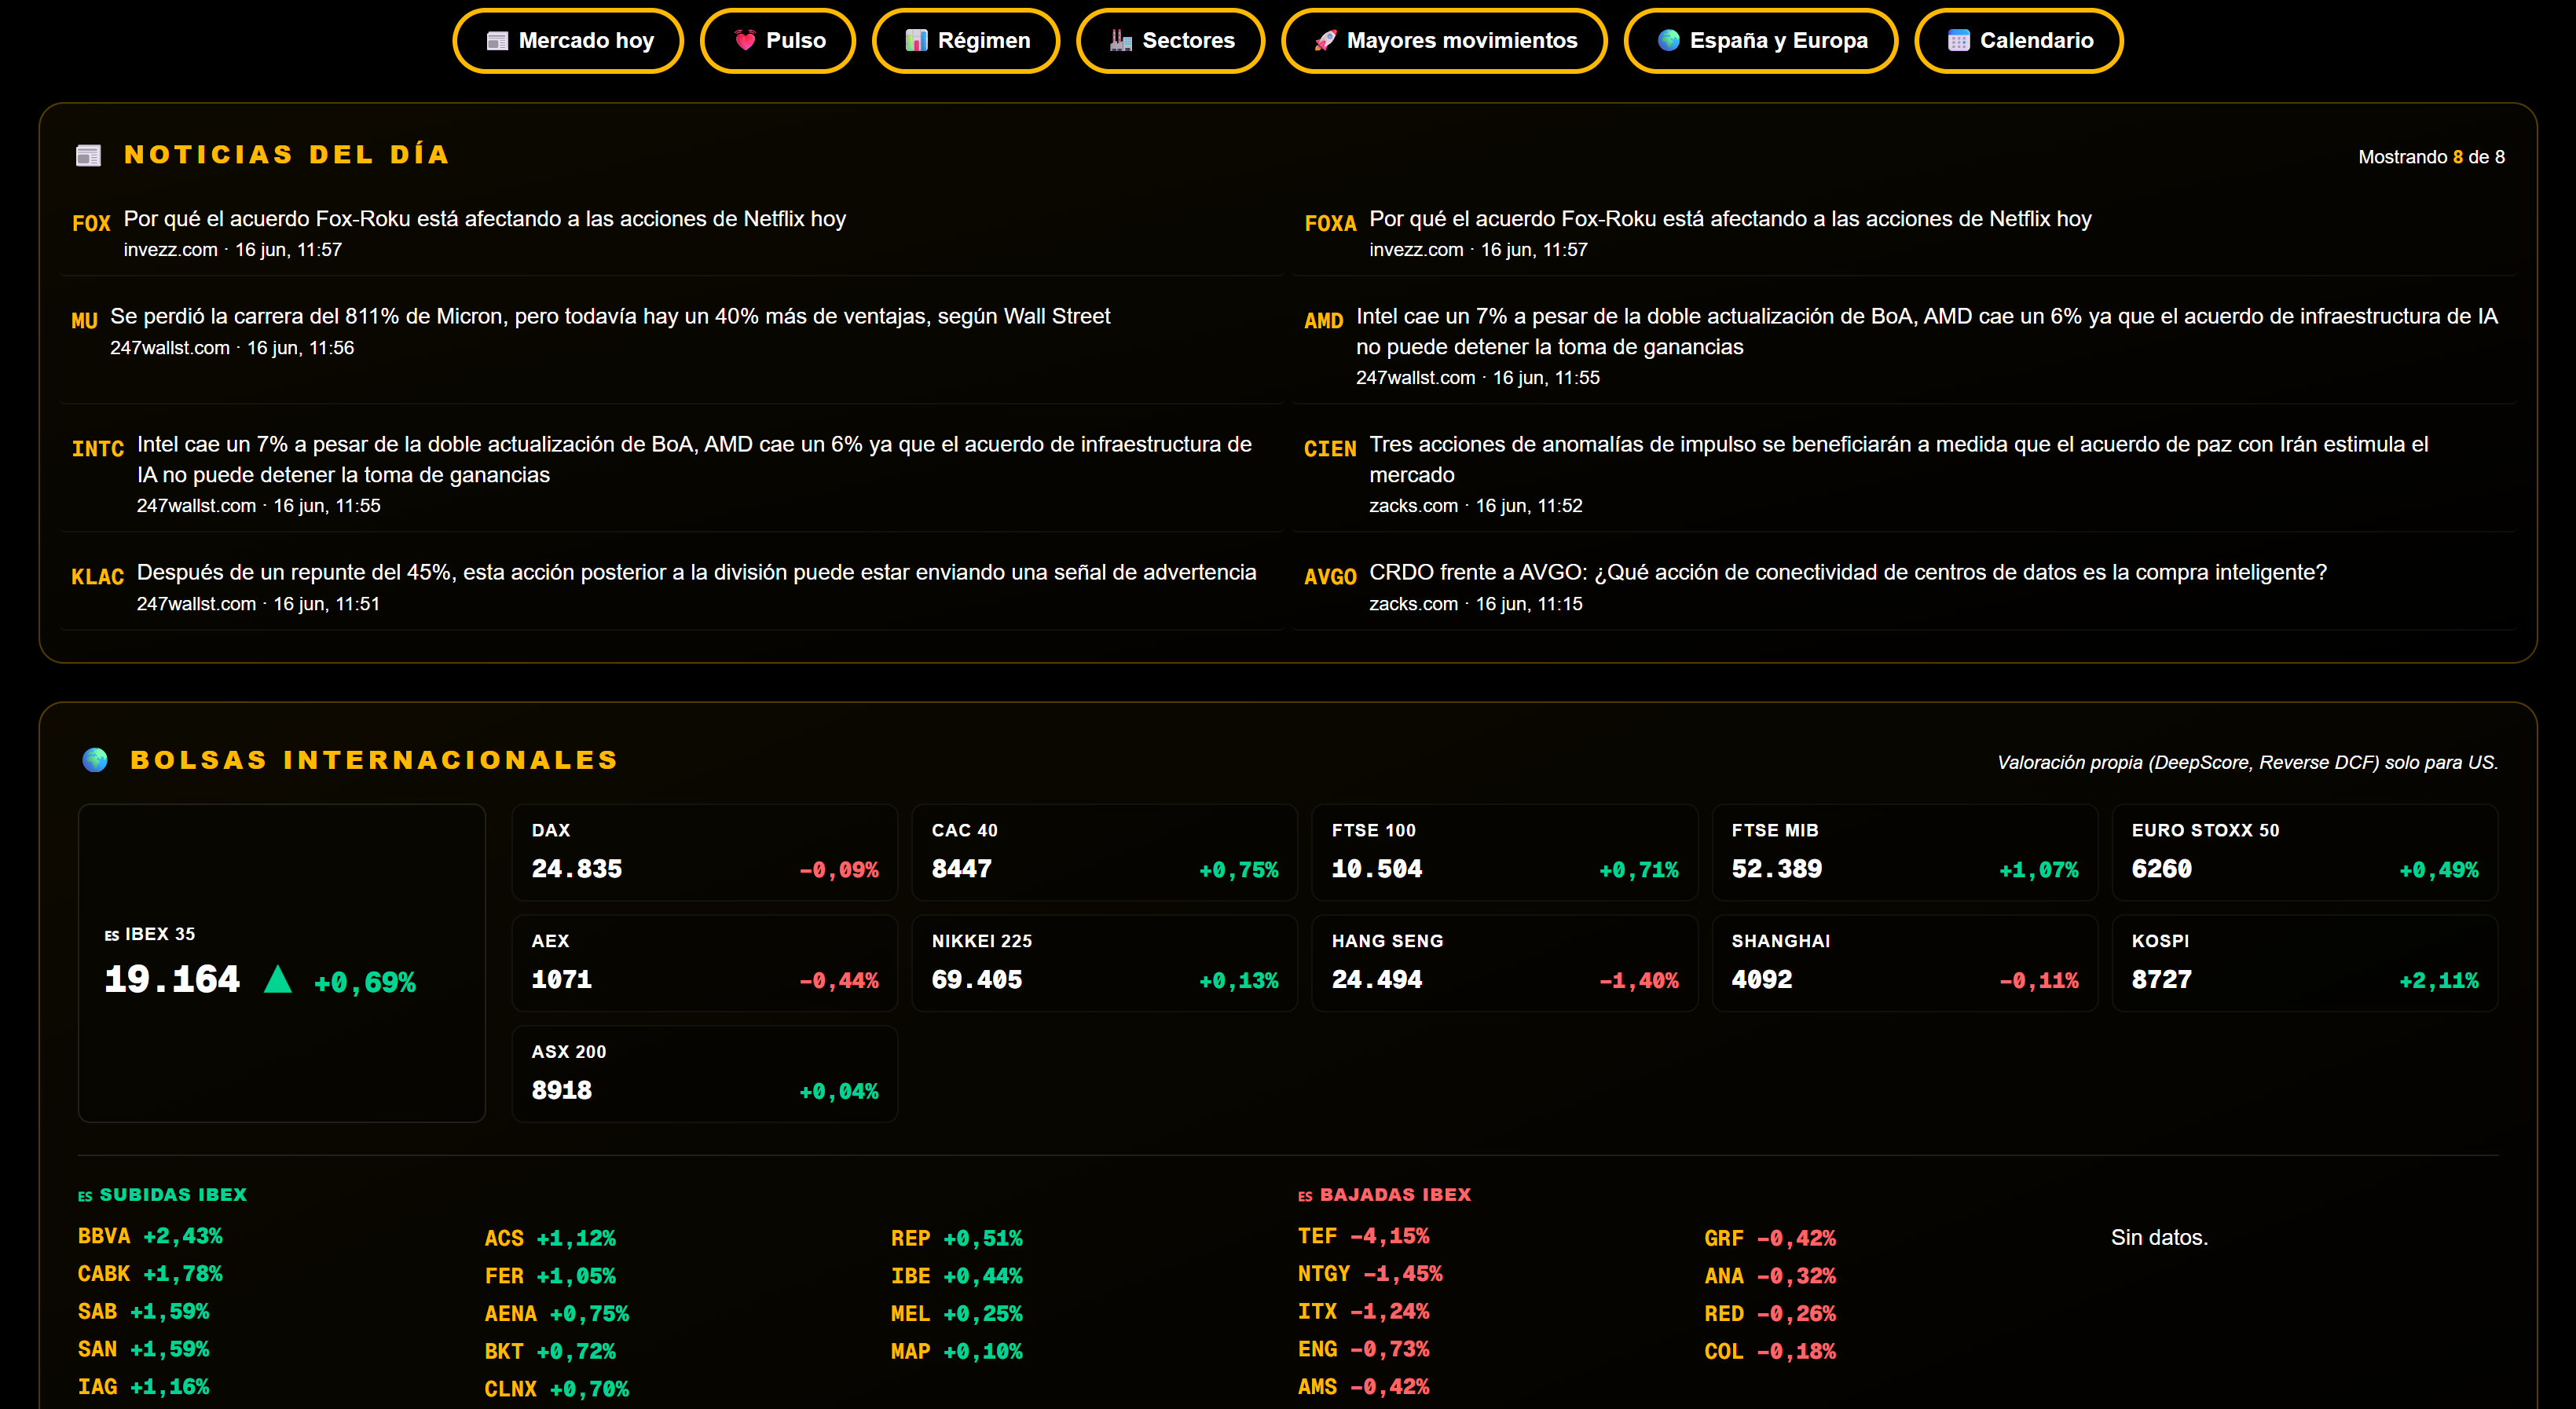
Spain and Europe built in
IBEX 35, leading Spanish stocks, pan-European leaders such as SAP, ASML or LVMH, and 12 international indices across Europe and Asia. Not as an afterthought, but integrated on the same level as Wall Street.
News of the day
Up to 60 news items on the stocks moving most during the session, ordered by time. Useful context without having to open a dozen websites.
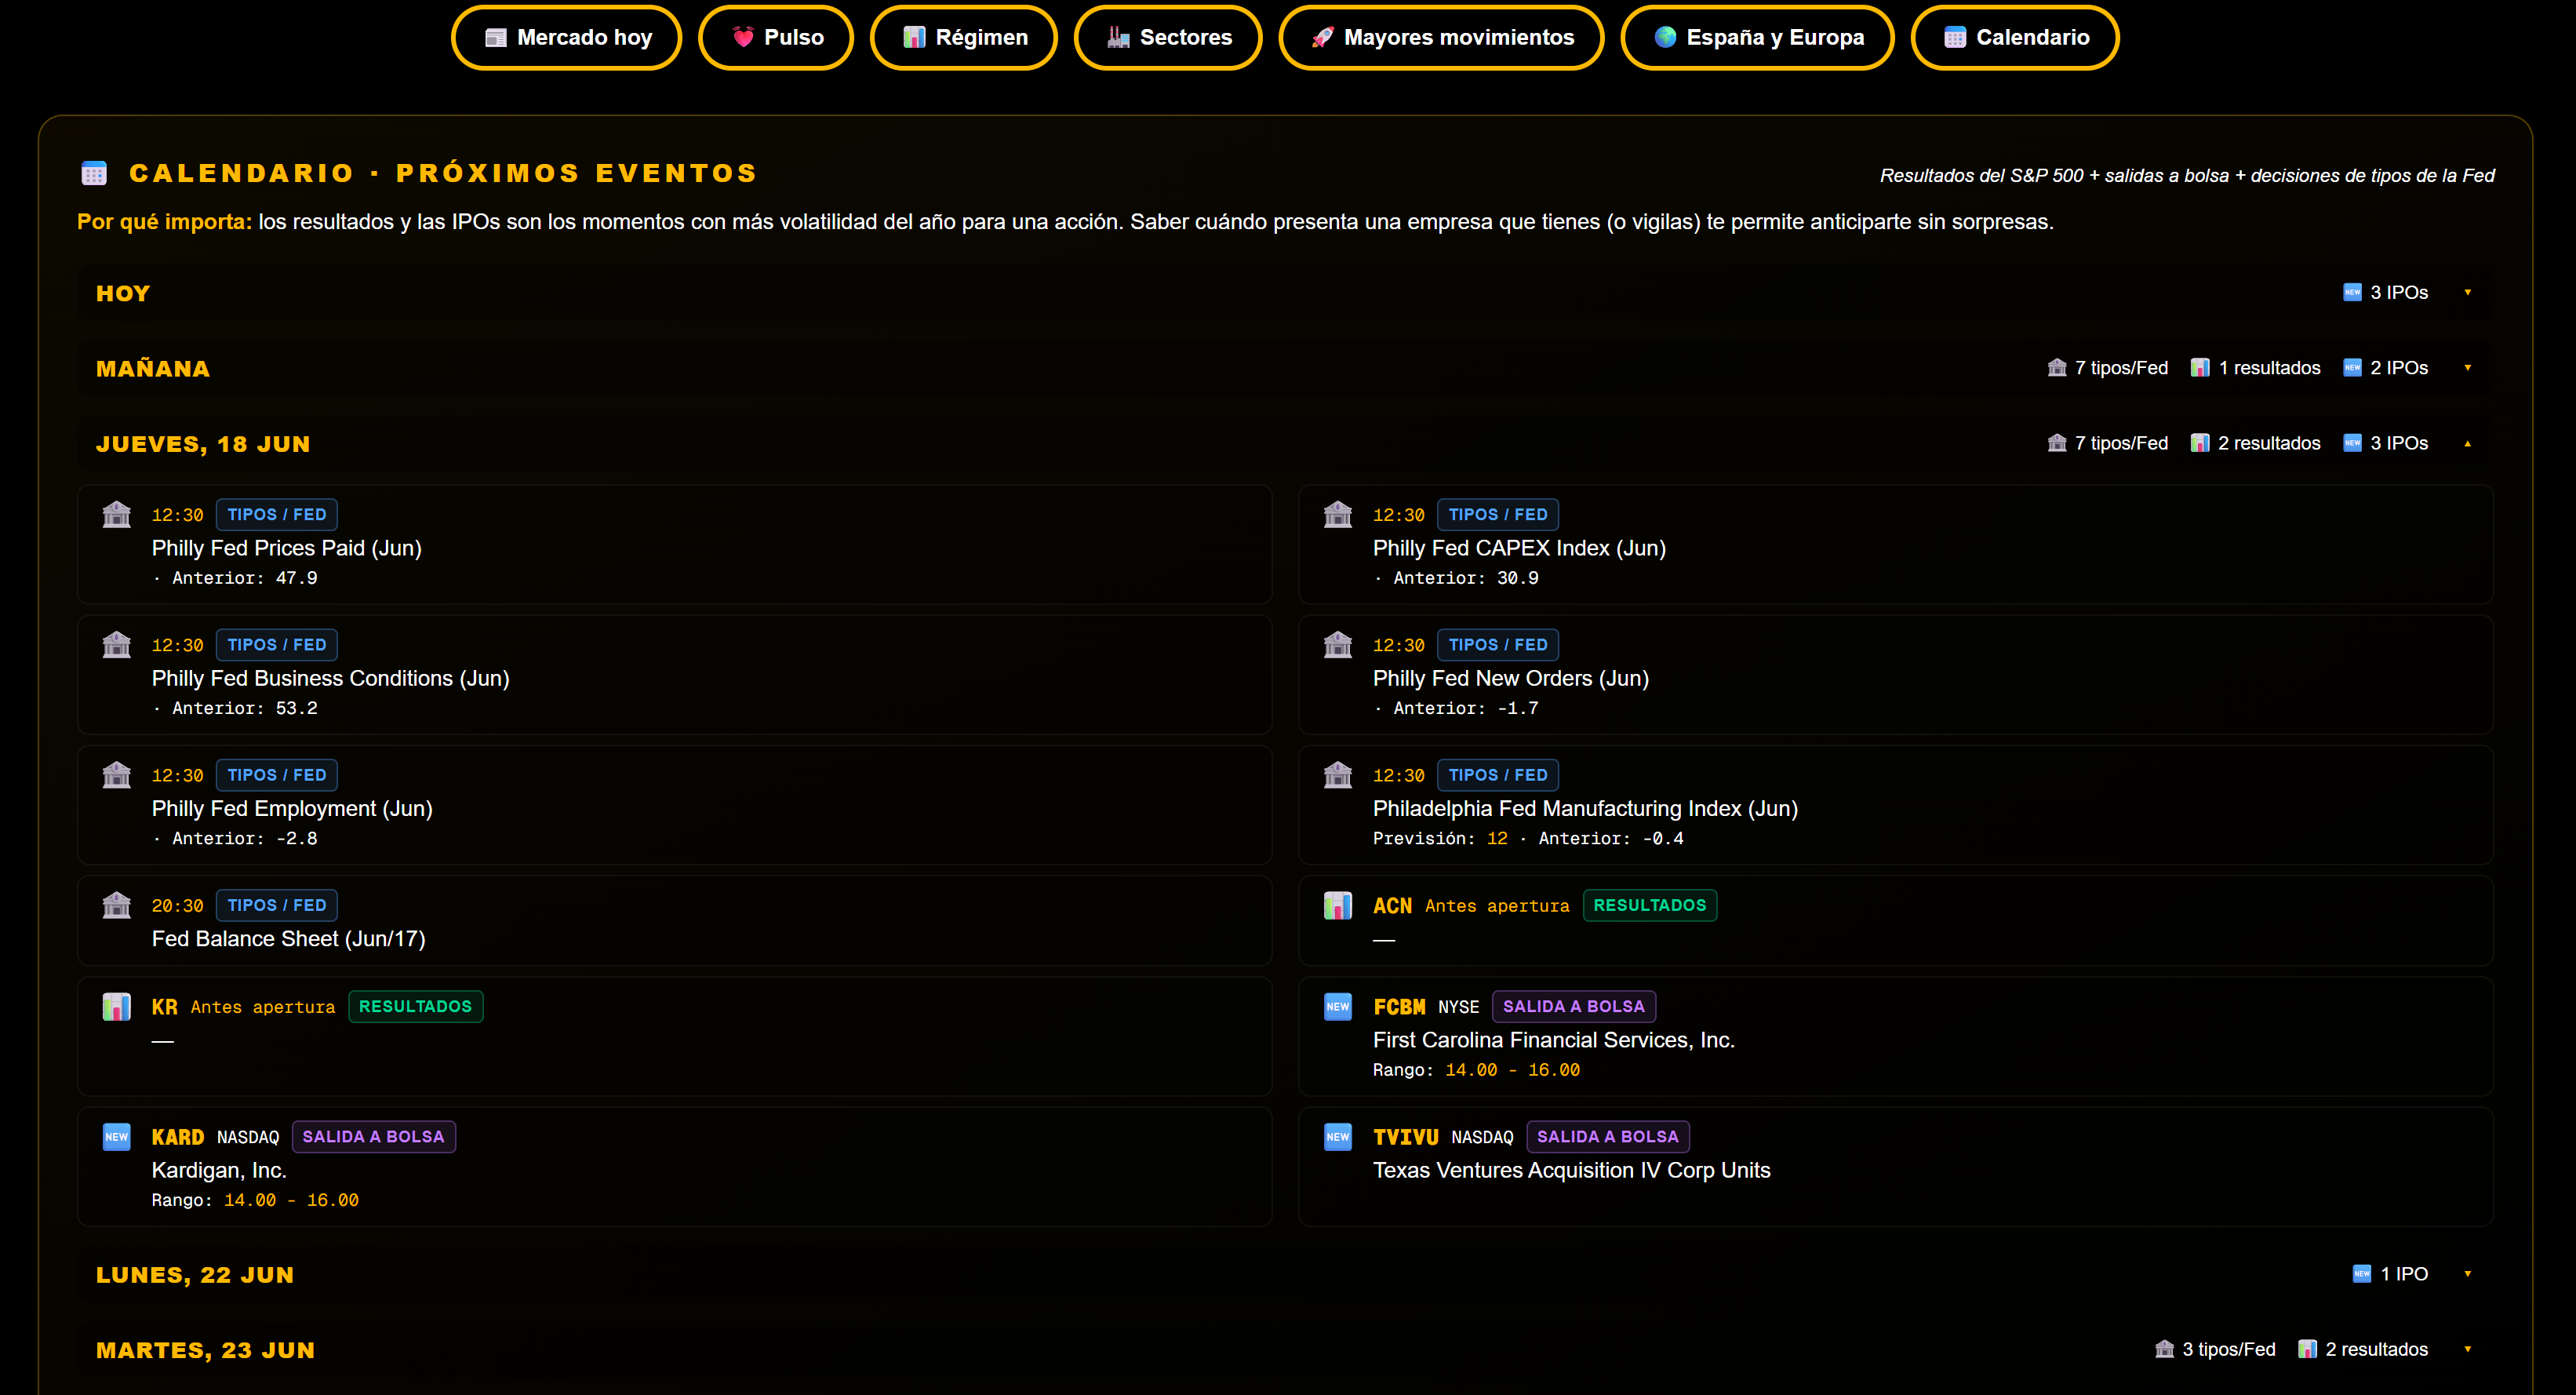
Events calendar
Quarterly earnings for the next 7 days, flagged as pre-market or post-market, and IPOs over the next 14 days. The events that can move prices, visible ahead of time.
The star block
Five market readings a day. Nothing to ask.
The European open, the Wall Street open, mid-session, the European close and the US close. In each window, DeepTicker cross-checks the real data of the session: top movers, sectors, market regime, IBEX, Europe, the S&P 500 and the 104 thematic ETFs.
The result is a structured reading to understand what’s happening on Wall Street, what’s going on in Europe and the IBEX, which themes are leading the session and which signals are worth watching.
With data discipline: the readings only use figures present in the session. If a data point isn’t available, DeepTicker doesn’t invent it; it says so.
Market map
The market map: where the money is moving today.
The full S&P 500 in a map sized by weight and 104 ETFs organized into 6 thematic blocks. Size shows the weight; color shows the performance. So you can tell at a glance whether the market is rotating into technology, gold, bonds, commodities, specific countries or defensive sectors.
Spain and Europe as standard · no surprises
The IBEX and Europe on the same level as Wall Street.
IBEX 35, leading Spanish stocks, pan-European leaders and 12 indices across Europe and Asia integrated into the dashboard, not tucked away as an afterthought.
You also get a calendar with earnings for the next 7 days and IPOs over the next 14, so you can flag the events that can stir up volatility before they hit.
Why it’s different
You don’t just see the map. You understand the reading.
Updates on its own
The data refreshes every 60 seconds on screen without reloading the page. The updates run in the background, so the dashboard loads fast and is ready when you open it.
Readings ready, nothing to ask
You don’t have to write prompts or build queries. DeepTicker publishes 5 readings a day from the real data of the session: moves, sectors, regime, ETFs, Europe, IBEX and Wall Street. You can read them in a few minutes.
Everything is clickable
Any ticker on the dashboard, whether from the map, the top movers or the trending list, opens its full profile in an overlay window. You go from the big picture to company analysis in one click.
Built for you, not half-translated
Sectors, regimes, events, earnings times and European context: all laid out clearly and built for the investor who watches Wall Street alongside Spain and Europe.
Tomorrow morning, open it before your broker.
During the 14-day free trial you get the full Market Dashboard, with DeepTicker’s readings included and no card required.
Frequently asked questions
Common questions about the Market Dashboard
What is the state of the market and how do I read it at a glance?
The state of the market is a snapshot of how the main indices, sectors and assets are behaving at a given moment. DeepTicker sums it up with 12 indicators, maps, ETFs, breadth, news and a calculated regime, so you can tell whether risk appetite, caution or risk aversion is leading the session.
What is market breadth?
Market breadth measures how many stocks are rising versus falling and what percentage of an index trades above its 50- and 200-day moving averages. It helps you tell whether a rally is backed by many companies or just a few. DeepTicker combines that information with the VIX and sector leadership to define the market regime.
How do I see which sectors are moving in the market today?
The market map by sectors shows the S&P 500 in a treemap sized by weight, colored by performance and with detail down to the industry level. You can also explore 104 thematic ETFs to spot rotations into technology, health, energy, gold, bonds, countries or investment styles.
How often does the market dashboard update?
The data refreshes every 60 seconds on screen without reloading the page. On top of that, DeepTicker publishes 5 market readings a day: the European open, the Wall Street open, mid-session, the European close and the US close.
Does it cover Spain, Europe, Canada and the UK?
Yes. DeepTicker integrates the IBEX 35, leading Spanish stocks, pan-European leaders and key markets such as the United States, Canada and the United Kingdom, plus international indices across Europe and Asia. The goal is to avoid a US-only view: you can follow Wall Street, Spain, Europe, Canada and the UK from the same dashboard, with data laid out clearly and easy to interpret.
Are DeepTicker’s readings investment recommendations?
No. The market readings summarise data, moves, sectors and events from the session. They help you understand the context better, but they are not financial advice or personalised buy or sell recommendations.