Tesla TSLAStock analysis: cheap or expensive?, valuation and dividends
Tesla, Inc. · Consumer Cyclical · US
$411.84
+8.46% today
Is Tesla a good stock to invest in? Is it cheap or expensive today? In this fact sheet you have the fundamental analysis of Tesla (TSLA), in English: the DeepTicker Score for quality, the P/E, the dividends and the metrics that really matter.
DeepTicker Score
50/100
Mixed
P/E
207.3x
Div. yield 0.0%
Market cap
$1.41T
52w: 288.77-498.83
DeepTicker Score by dimension
Five dimensions that sum up the quality of Tesla. The metric-by-metric detail and the reason behind each score are in the full analysis.
Key metrics
P/E
207.3x
ROIC
3.2%
Operating margin
5.0%
Net debt / EBITDA
-0.6x
Dividend yield
0.0%
EV/EBITDA
116.1x
Preview of the full analysis
This is what you will see for Tesla inside DeepTicker: an interactive chart, the +120 metrics with sector percentiles and the DeepTicker Score for quality. Sign up free to unlock it.
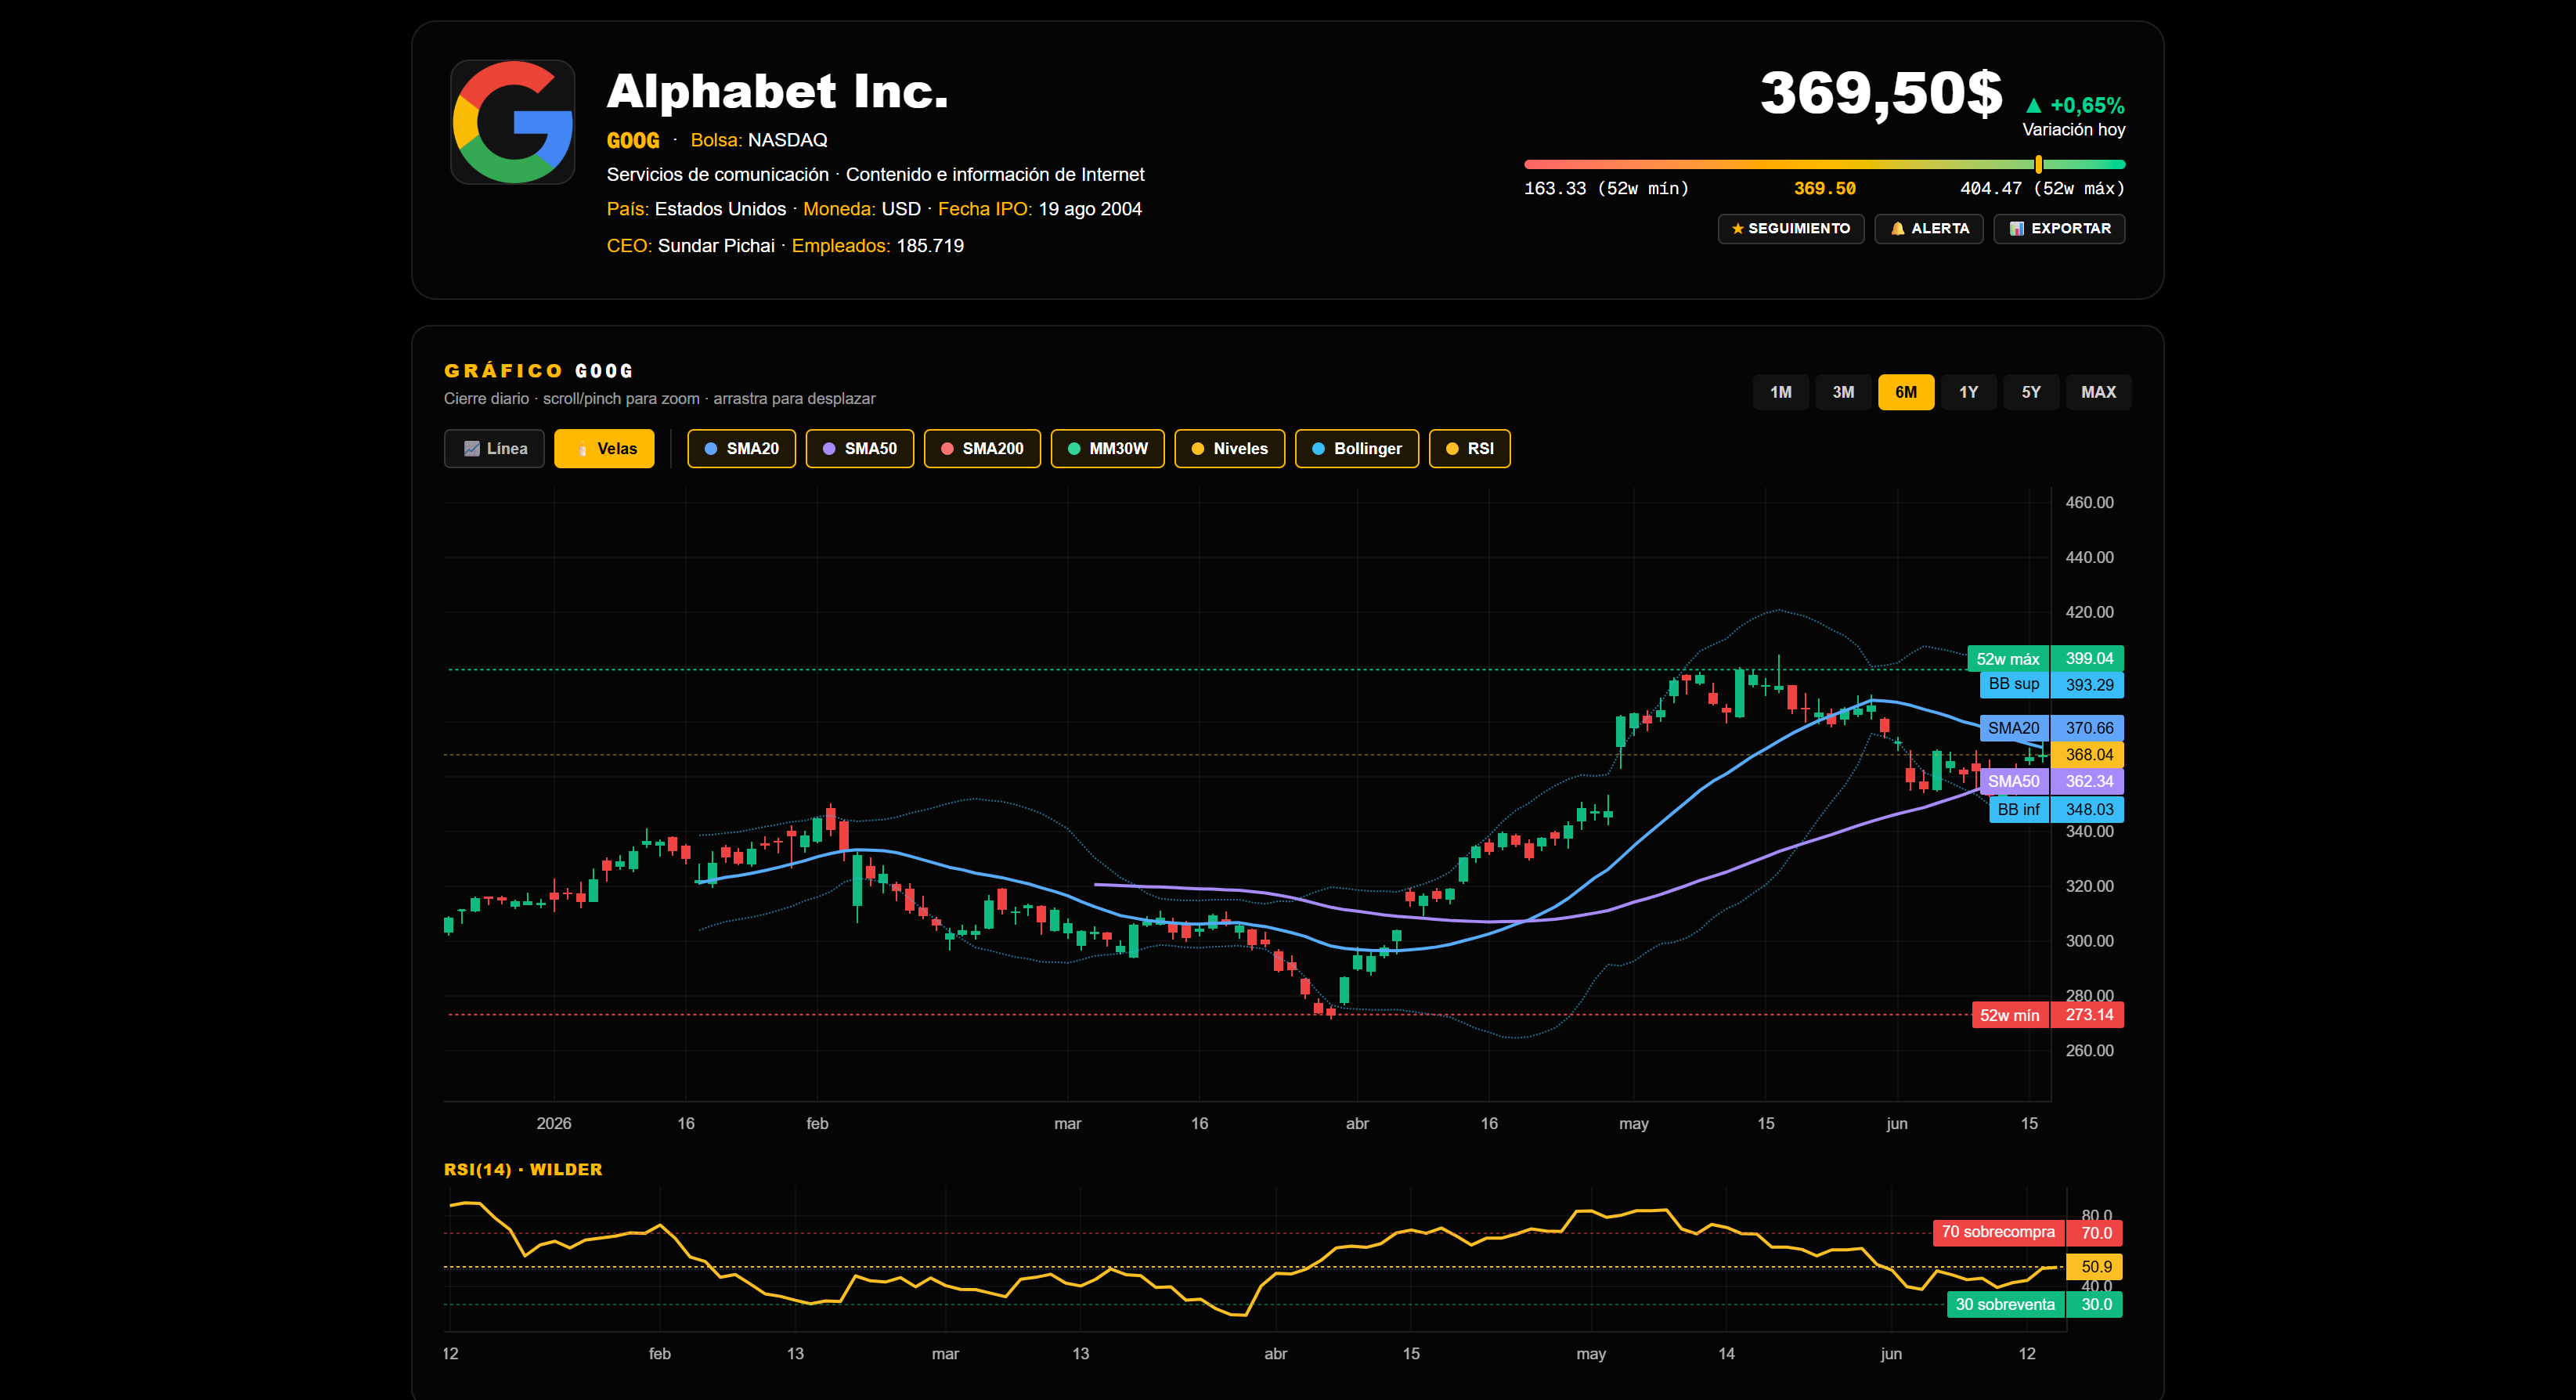 Chart
Chart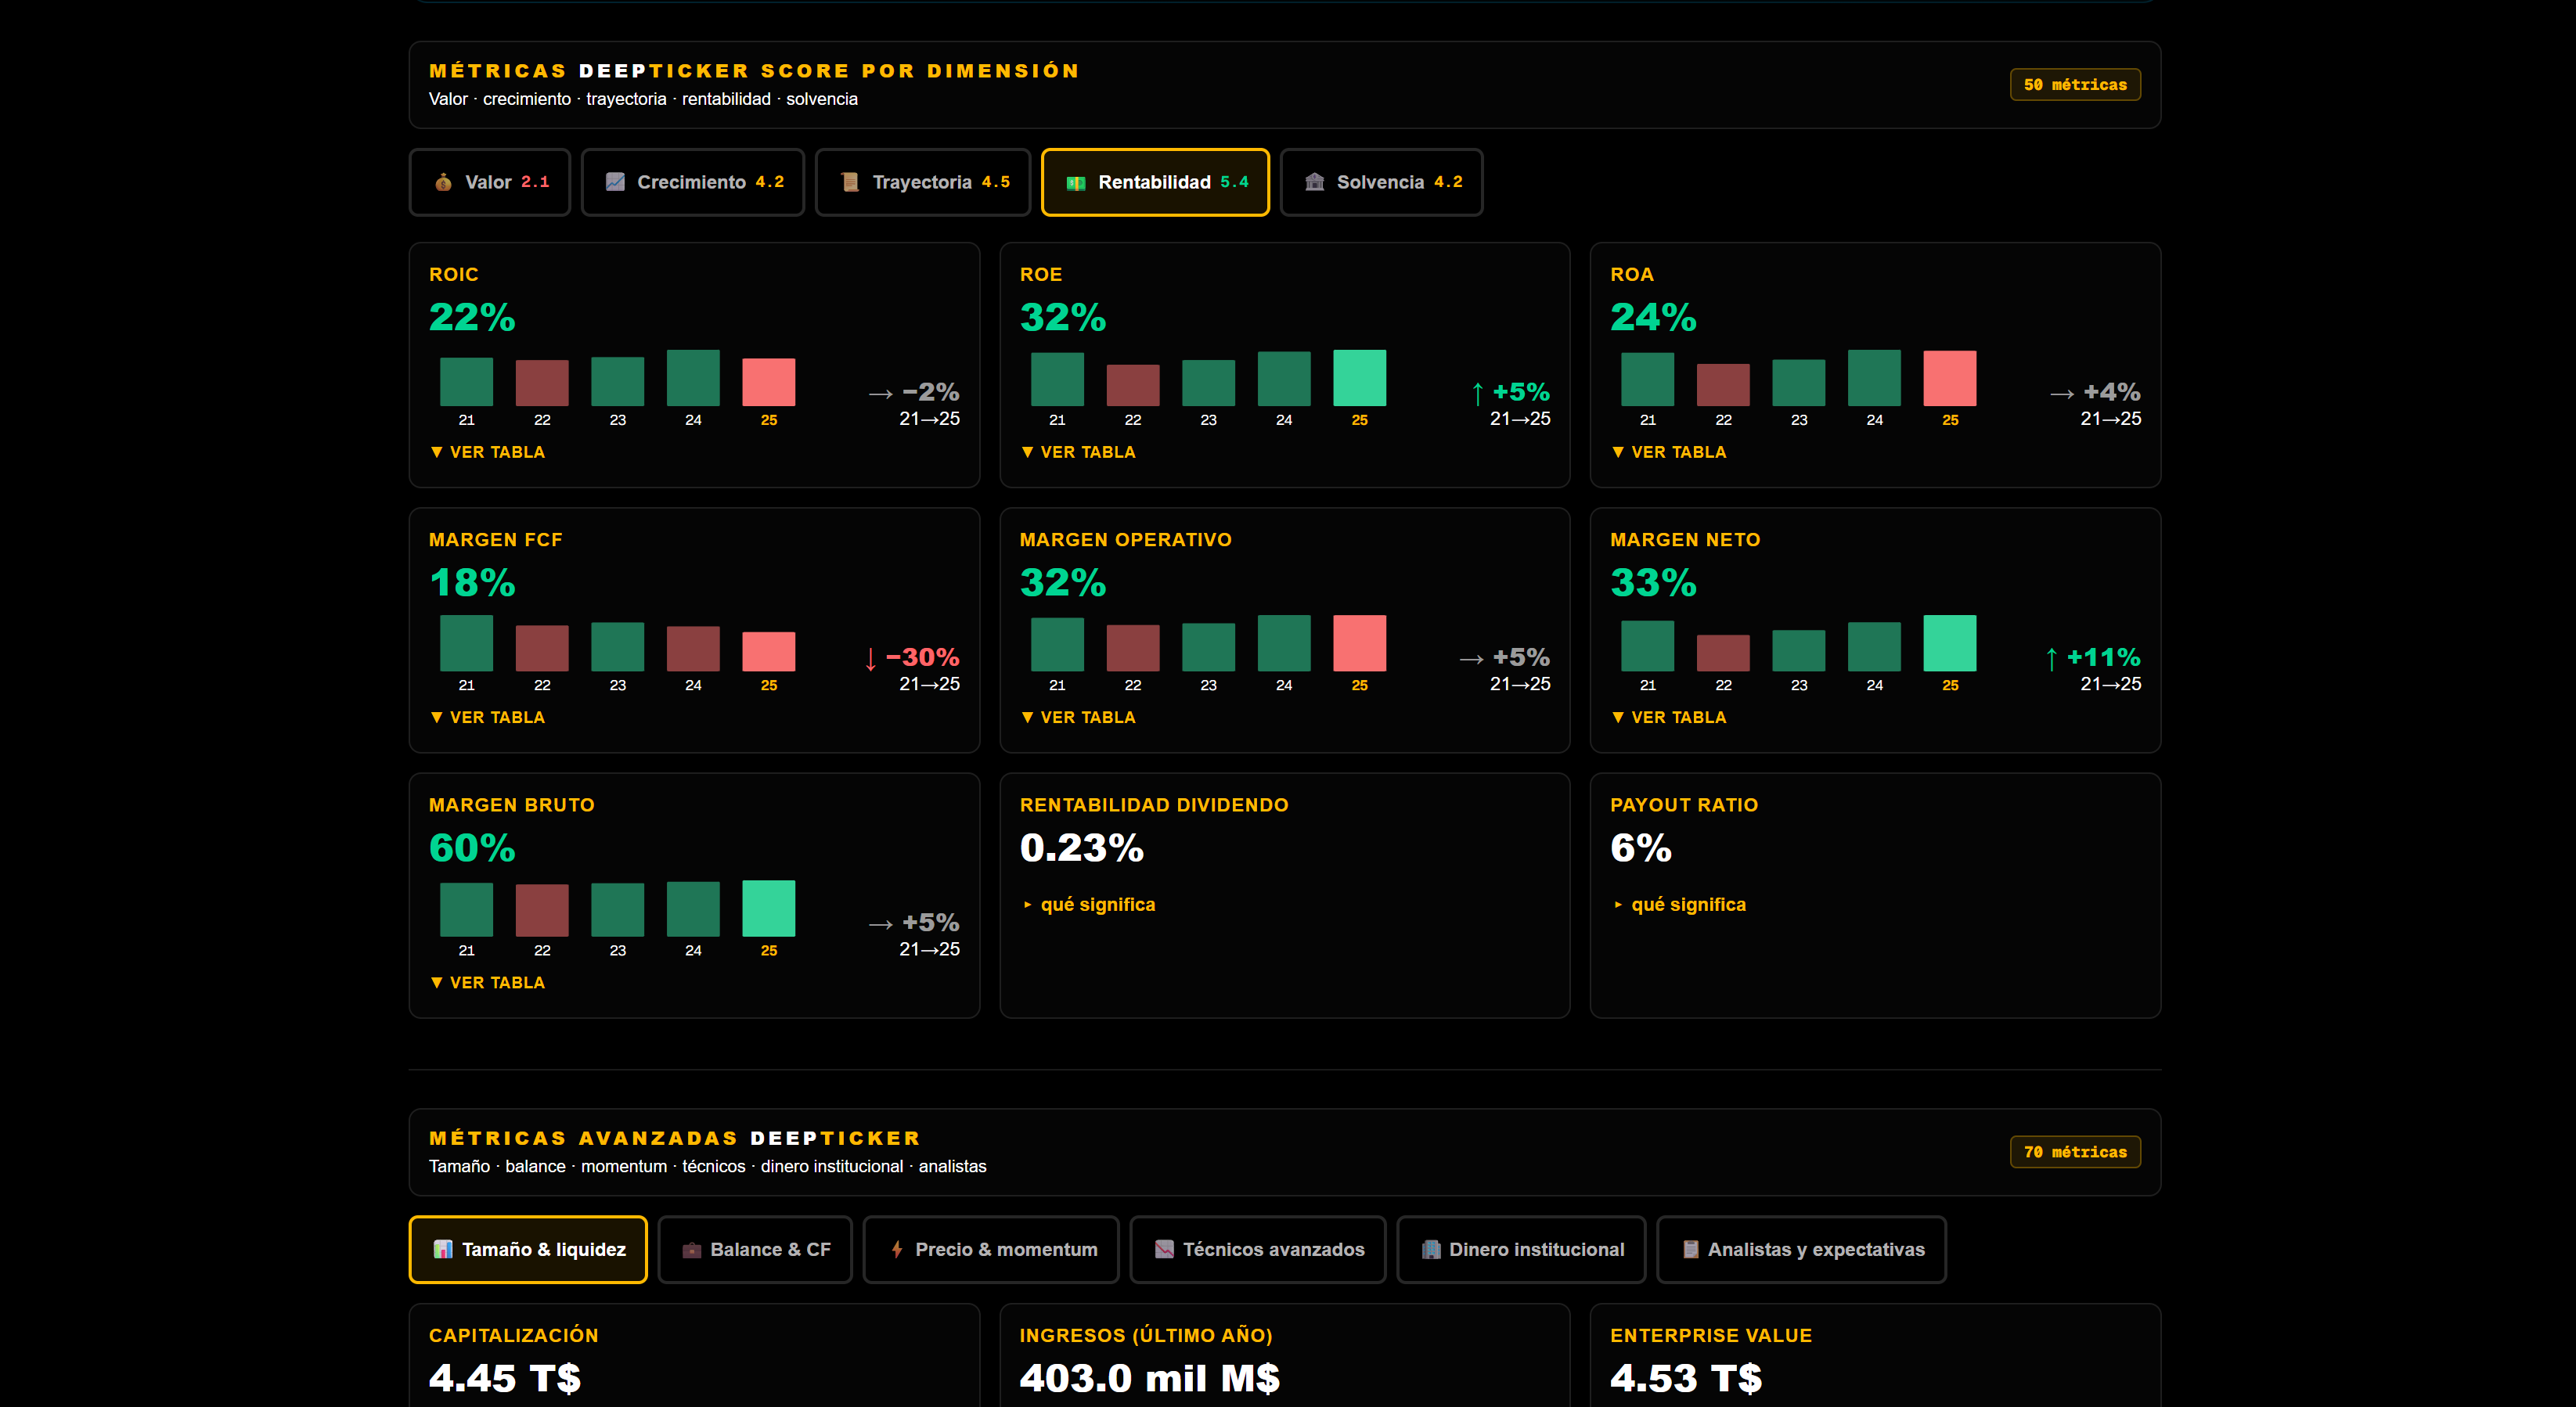 +120 metrics
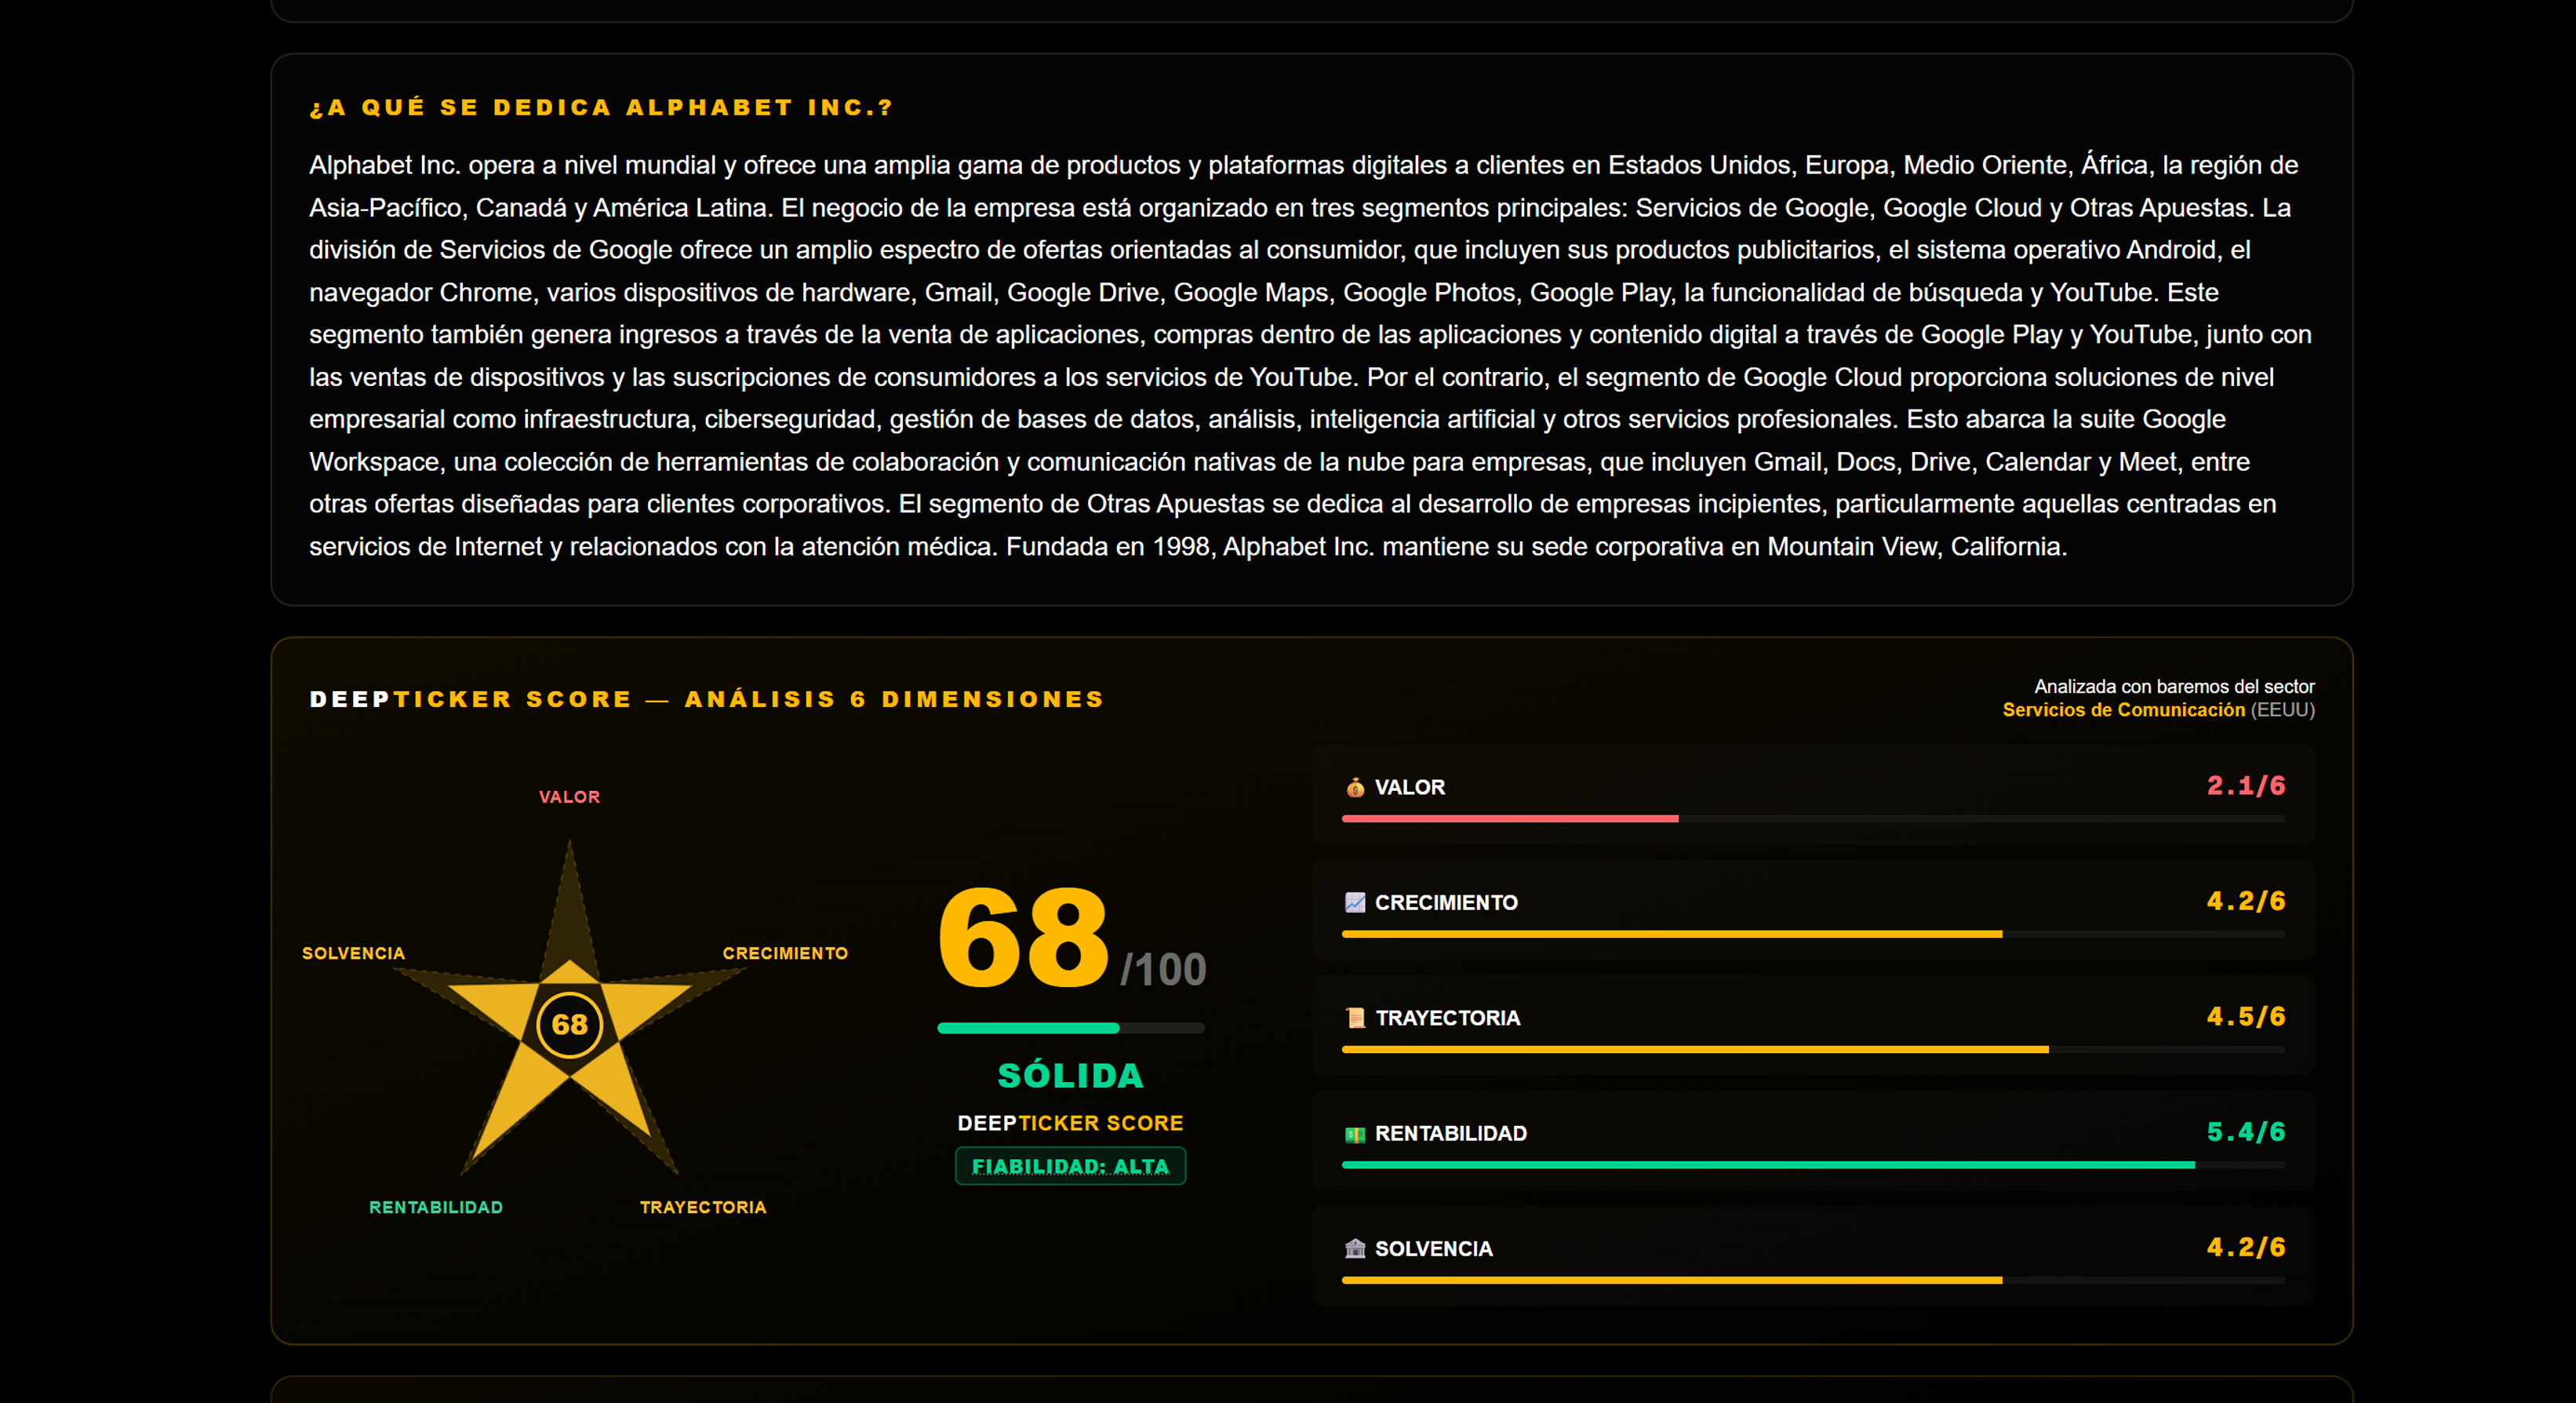 DeepTicker Score
How is Tesla stock doing?
Tesla (TSLA) trades at $411.84 (+8.46% in the last session), within the Consumer Cyclical sector. This fact sheet gives you its full stock analysis: valuation, quality (DeepTicker Score), P/E and dividends. This is educational information, not financial advice.
Is Tesla cheap or expensive?
To gauge whether Tesla (TSLA) is cheap or expensive, DeepTicker looks at its P/E (207.3x) against its sector and its DeepTicker quality Score (50/100), together with its fundamentals (margins, debt, growth) and its dividend yield. This is educational information, not financial advice.
What is the price target for Tesla?
DeepTicker does not publish an analyst "price target" for Tesla. Instead we give you its business quality (DeepTicker Score), its multiples such as the P/E and its fundamentals compared with the sector, so you can judge for yourself whether the current price is reasonable. A specific price target depends on assumptions that change every quarter.
Does Tesla pay dividends?
Tesla does not pay a meaningful dividend right now (dividend yield close to 0%). That is common in companies that reinvest all of their profit into growth.
What is the P/E of Tesla?
The P/E of Tesla is 207.3x. On its own it does not tell you whether the stock is expensive: you have to compare it with its sector, its history and its growth. That is why DeepTicker complements the P/E with the DeepTicker quality Score and fundamentals by dimension.
Is Tesla a good company to invest in?
Tesla earns a DeepTicker Score of 50/100 (Mixed), which sums up its fundamental quality across 5 dimensions: valuation, growth, track record, profitability and solvency. A high score signals a good business, not a recommendation to buy.
How a company like Tesla is valued
Consumer cyclicals (luxury, retail, autos) like Tesla depend on the economic moment: they sell more when the economy is doing well. That makes their earnings — and their P/E — swing with the cycle.
It pays to look at brand strength, the operating margin across the cycle, debt and the ability to hold sales in a recession. A low multiple at the peak of the cycle can be deceptive.
Whatever the sector, at DeepTicker Tesla goes through the same objective filter: a Reverse DCF that estimates its fair value from its cash flows and a DeepTicker Score that rates its quality. That way you compare the business on consistent criteria instead of relying on a single multiple or a headline.
Quality versus price: the two key questions about Tesla
Analyzing Tesla comes down to two questions that are best kept separate. The first is about quality: is it a good business? It's answered by ROIC, margins, solvency and the presence of a moat (competitive advantage). The second is about valuation: is it expensive or cheap? It's answered by multiples and, above all, by the intrinsic value estimated with a DCF.
The classic mistake is to confuse the two. A top-quality company can be a poor investment if you pay an outrageous price, and a mediocre company can be a value trap even if it looks cheap. The opportunity usually lies where the two meet: a good business at a reasonable price, with a margin of safety that protects you from your own estimation errors.
That's why DeepTicker always shows both sides of Tesla together: the quality score (DeepTicker Score) and the valuation verdict (expensive, fair or cheap). Looking at only one of the two leads to the wrong conclusions.
Which metrics to look at in Tesla and how to interpret them
To understand Tesla through the numbers, these are the key metrics and what they mean. The P/E (207.3x) tells you how many times annual earnings you're paying; it makes sense to compare it with its sector and its own history, not in absolute terms. ROIC (3.2%) measures the return the company earns on the capital it employs: the higher and more sustained, the better the business.
The operating margin (5.0%) reflects how much it earns on each dollar of sales after operating costs; high, stable margins usually point to a competitive advantage. Net debt/EBITDA shows how many years of operating profit it would need to repay its debt (above 3-4x is considered high), and the dividend yield (no meaningful dividend) what it pays out relative to the price.
A single metric in isolation says little; what's useful is the context. That's why it pays to look at each ratio for Tesla against its sector (a P/E of 25 isn't the same in a bank as in a tech company) and against its own history (is it more expensive or cheaper than its average of recent years?). DeepTicker shows these values with sector percentiles, which tell you at a glance whether a figure is high or low for its industry.
No metric stands on its own: the key is to cross quality (ROIC, margins, solvency) with valuation (P/E, EV/EBITDA and the intrinsic value from the DCF). You can dig deeper into each concept in our stock-market glossary.
What the DeepTicker Score of Tesla measures
The DeepTicker Score of Tesla (50/100 (Mixed)) sums up its fundamental quality in a score from 0 to 100, built from five dimensions: valuation, growth, track record, profitability and solvency. It is not a buy recommendation, but a quick way to place the quality of the business against thousands of comparable companies.
A high score signals a solid business (good return on capital, healthy growth, sound finances), but remember that high quality does not mean a cheap price: a great company can be expensive. That's why it pays to read the DeepTicker Score alongside the valuation verdict (expensive, fair or cheap).
The Score also carries an associated level of confidence: when data is missing or the company is atypical (banks, insurers, recently listed companies), it pays to take it with more caution and lean on metrics specific to its sector. No number replaces understanding the business of Tesla; the Score is a starting point for deciding what deserves a deeper study.
How to analyze Tesla on your own, step by step
1) Understand the business: what Tesla does and how it makes money. 2) Measure its quality with the DeepTicker Score, ROIC and margins. 3) Check the valuation with the Reverse DCF: what growth its price implies and whether that's reasonable. 4) Review the balance sheet (debt) and the momentum. 5) Decide with a margin of safety: good business + reasonable price + acceptable risks.
You'll find the full method in our guides on how to analyze a stock and how to tell whether a stock is expensive or cheap. At DeepTicker, the five steps are on a single screen for Tesla and for thousands more companies.
Common mistakes when analyzing stocks like Tesla
The most common mistake is to look only at the price or at the P/E in isolation: cheap is not the same as a good investment, and expensive isn't always bad. Another frequent error is ignoring debt, which can turn a good year into a problem, or comparing multiples across very different sectors as if they were equivalent.
It also pays to be wary of magical "price targets" and of decisions driven by headlines or emotions. A serious analysis crosses quality and valuation data, looks at several years (not a single quarter) and demands a margin of safety.
And one last classic: confusing a good company with a good investment at any price, or selling the moment the stock drops without checking whether the thesis is still intact. Discipline — a clear, repeatable method — matters more than nailing a single move. This is educational information, not financial advice.
Which external factors influence Tesla
No company lives in isolation. Interest rates affect almost every stock: when they rise, future money is worth less today and valuations — especially of growth companies and heavily indebted ones — tend to compress; when they fall, the opposite happens. That's why the cost of capital (WACC) used in a DCF moves with rates and changes the estimated fair value.
The economic cycle drives demand: cyclical companies (industry, materials, discretionary consumption) suffer more in a recession, while defensive ones (consumer staples, healthcare, utilities) hold up better. Knowing where we are in the cycle helps you interpret the results of Tesla and avoid mistaking a single bad quarter for structural deterioration.
For companies with international sales, the exchange rate matters when converting revenue into their currency, and inflation pressures costs and margins. None of these factors can be controlled, but it pays to keep them in mind when reading a single quarterly snapshot: serious fundamental analysis looks at the trend over several years, not a single data point.
How to follow the valuation of Tesla with DeepTicker
At DeepTicker you have Tesla with everything on a single screen: the quality DeepTicker Score, the Reverse DCF that tells you whether it's expensive or cheap, the more than 120 metrics with sector percentiles, the chart, the news and an AI thesis (strengths and risks). Instead of building spreadsheets, you see the analysis already done and can audit it step by step.
The fundamental data is updated periodically from official sources, and you can save Tesla to your portfolio or your watchlist to follow its evolution. If you want to understand how we calculate each number, it's all explained in our methodology.
Remember: DeepTicker is a tool for analysis and information, not an adviser. It gives you the data and the reasoning so that you decide for yourself, with judgment and with your own margin of safety.
Keep learning
Learn how to analyze a stock step by step and how to tell if it is cheap or expensive. Review what the P/E, the ROIC, the DCF or the moat mean in the glossary, and compare with the ranking of the best stocks by quality. You can also screen thousands of companies in the stock screener.
Frequently asked questions about Tesla on DeepTicker
Is the Tesla analysis financial advice?
No. All of the Tesla information on DeepTicker is educational and based on fundamental data. It is not a buy or sell recommendation nor personalized investment advice; every decision is the investor's own responsibility.
Where does the Tesla data come from?
From financial data providers based on the official information the company publishes (accounts, earnings). It is updated periodically; the price may be shown with some delay depending on the market.
What is the DeepTicker Score of Tesla?
A quality grade from 0 to 100 that combines five dimensions (valuation, growth, track record, profitability and solvency). It helps place the quality of Tesla's business against thousands of companies, not as a recommendation.
Can I see the full Tesla analysis for free?
Yes: you get a 14-day trial with everything, no card required. And the Contest and My Portfolio are free forever, so you can start following Tesla without paying anything.
Does DeepTicker cover US and international stocks?
Yes. DeepTicker analyzes thousands of companies from the US, Europe and China with the same methodology, so you can compare Tesla with companies from all over the world.
Which companies can I compare Tesla with?
The most useful approach is to compare it with companies in the same sector and size. In the DeepTicker stock screener you can filter by sector, country and market cap, and in the rankings see how Tesla stacks up against others by DeepTicker Score and by valuation.
Full analysis
Want the full Tesla analysis?
Unlock the DeepTicker Score with its 5 dimensions, the 120 metrics with sector percentiles, the interactive chart and the alerts. 14 days free, no card.
Educational information based on fundamental data, not financial advice nor a recommendation to buy. Data as of the last update.