Stock Market Simulator: learn, test strategies and analyze your portfolio.
DeepTicker's Stock Market Simulator gives you a portfolio to invest with real market prices. Start with virtual money to learn and test strategies risk-free, or replicate your real broker portfolio to analyze it with far more metrics.
Add stocks and ETFs from the world’s main exchanges: the US, Spain, the UK, Canada, Australia, Europe and China. DeepTicker detects the currency, converts it to dollars and computes everything for you.
No broker connection. No shared passwords. And because you also get the market dashboard, the screener and the analysis of every ticker in the same platform, you can decide with much sharper judgment. Free forever.
Who it is for
One simulator, three ways to use it.
🎓
Learn without risk
If you are just starting out, practice with virtual money and real prices. Buy, sell, make mistakes and understand what happens, without risking your own money.
🧪
Test strategies
Put your ideas to the test before taking them to your broker. Measure return, risk and market comparison to see whether your strategy holds up beyond a single lucky trade.
📊
Replicate your real portfolio
Already investing? Record your broker portfolio and analyze it with far more metrics than your broker gives you: TWR, alpha, Sharpe ratio, drawdown and year-by-year results.
What it is
What a stock market simulator is (and why this one is different).
A stock market simulator lets you invest with virtual money and real prices to learn and test strategies without risking your capital. Most stop there. DeepTicker goes further: you can also replicate your real portfolio and measure it with metrics your broker does not give you.
The key is comparing your portfolio against an equivalent S&P 500 investment: DeepTicker simulates what would have happened if you had invested the same money in SPY, on the same dates and with the same cash flows. That makes the comparison fairer than looking at an index in the abstract.
And because the simulator lives inside DeepTicker, you have the market dashboard, the screener and the analysis of every stock in the same place: you can study a company and record it in your portfolio without switching tools.
Professional metrics
The metrics that explain how you are doing.
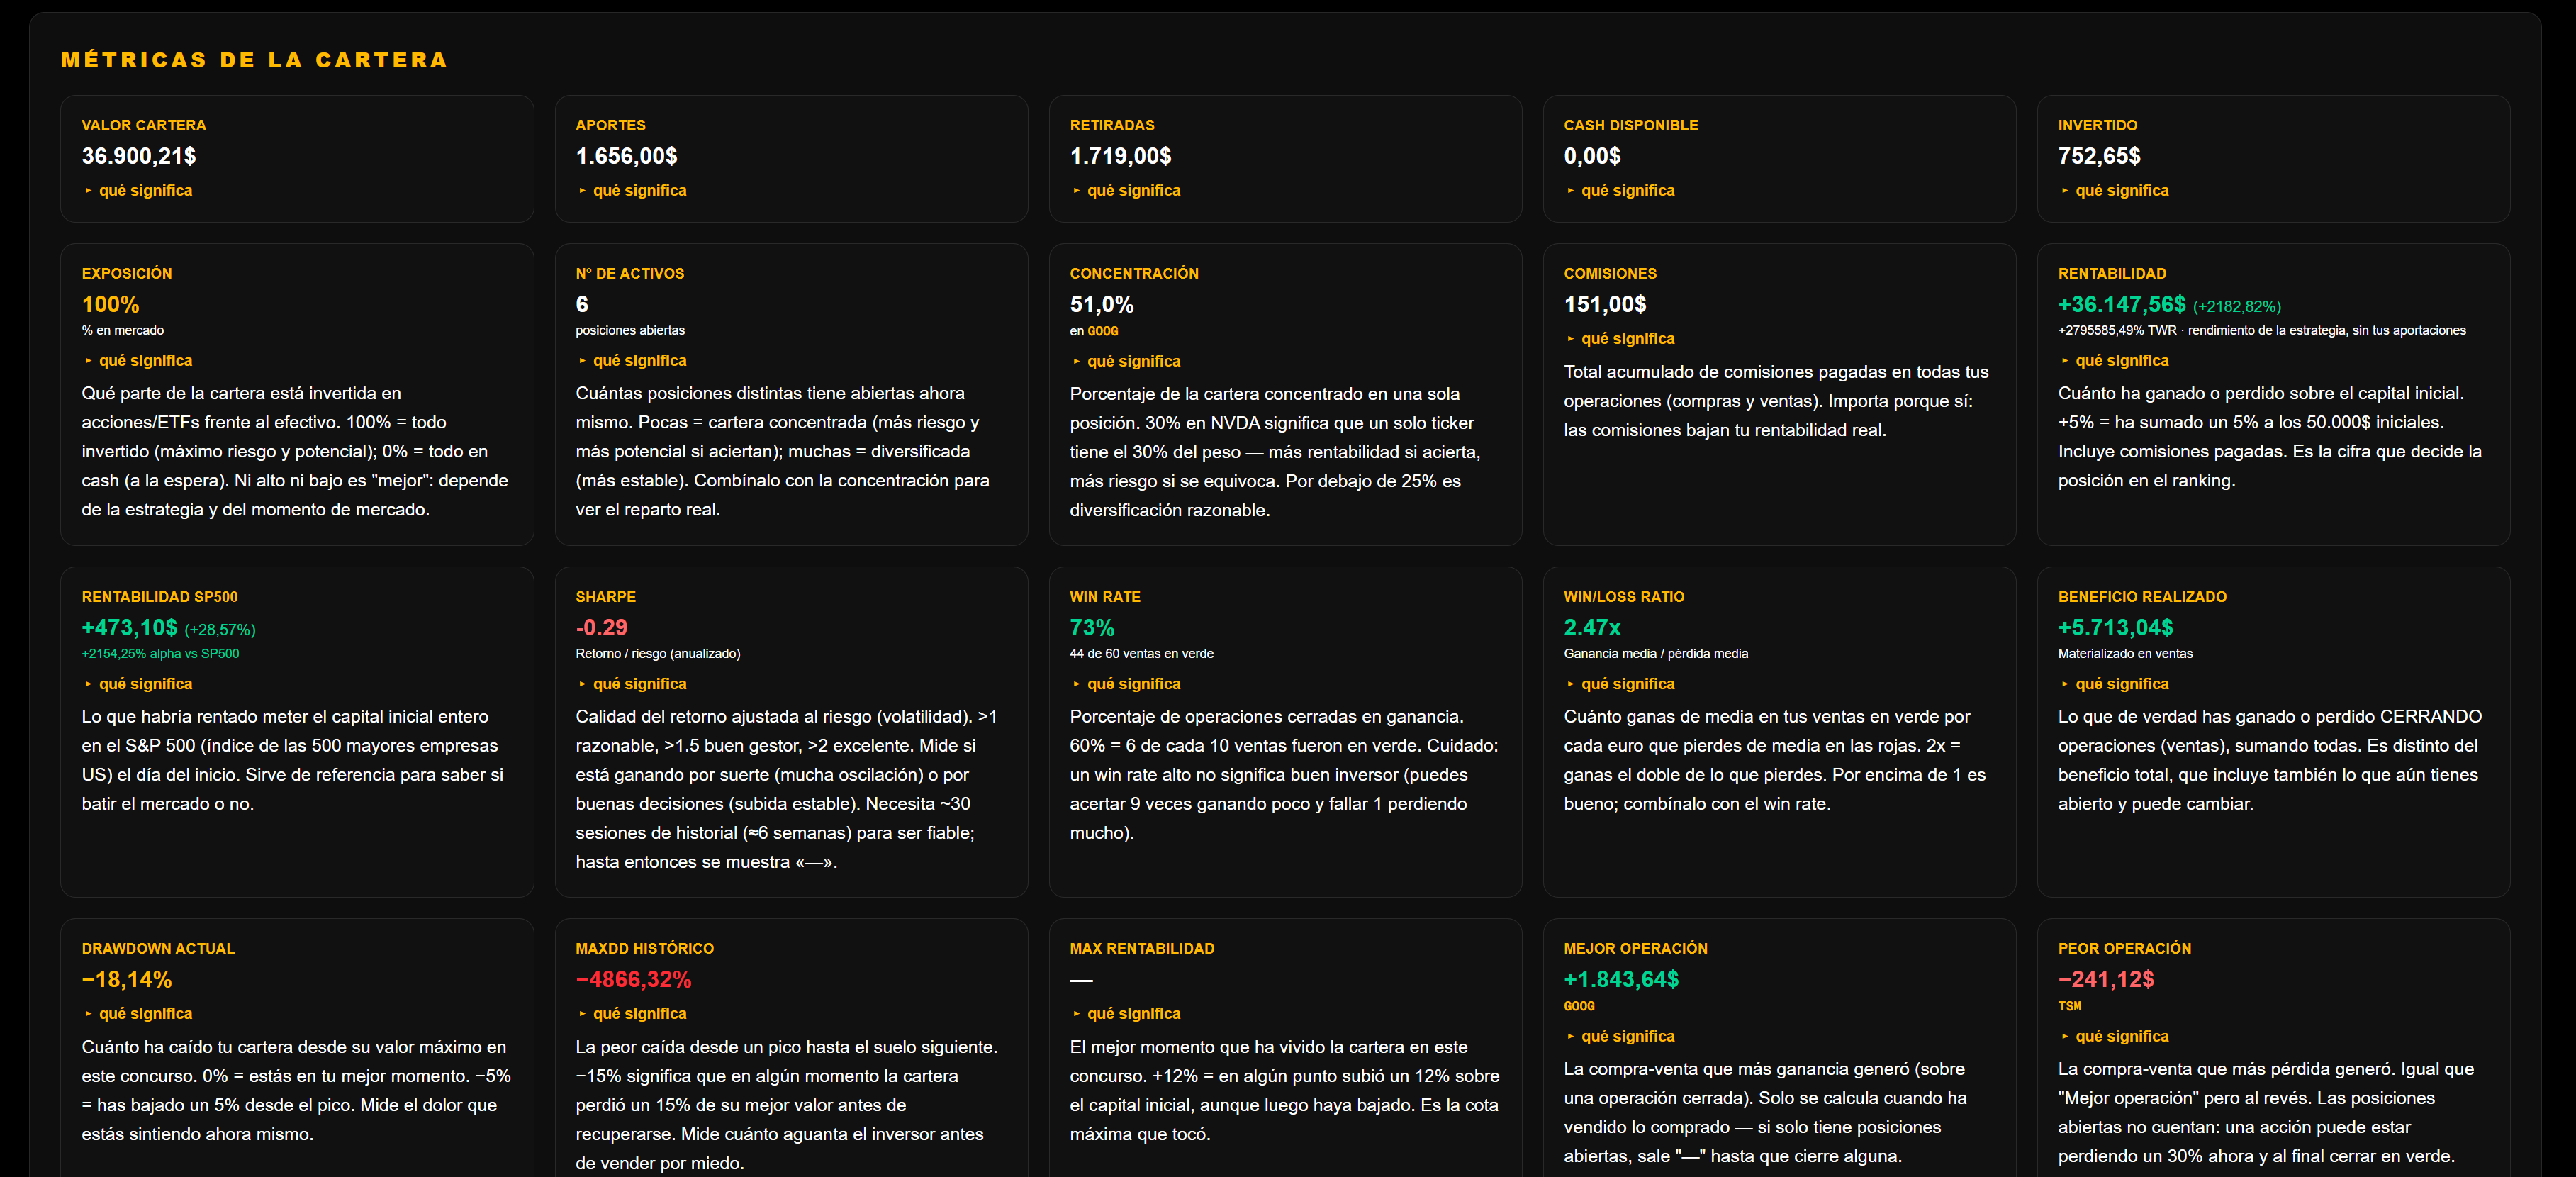
The simulator does not stop at “you made X”. It shows you return, risk, drawdowns, comparison against the market and the quality of your decisions. The idea is that you can read your portfolio the way a manager would, but explained in plain language.
Money gain
In USD and in %
The real money you have made or lost. It is calculated as the current portfolio value plus withdrawals, minus deposits. It shows your total economic result, without confusing it with your percentage return.
TWR · Time-Weighted Return
Comparable return
The return that measures how your management has performed while isolating the effect of when you put money in or took it out. It is a common metric for comparing portfolios because it neither rewards nor penalizes you simply for adding capital at a particular moment.
Alpha vs S&P 500
A fair comparison
It measures how much better or worse you are doing than an equivalent S&P 500 investment. DeepTicker does not compare your portfolio against a generic buy-and-hold: it simulates what would have happened if your same deposits and withdrawals had been made in SPY on the same dates.
Sharpe ratio
Risk-adjusted return
The Sharpe ratio measures how much return you get for each unit of volatility taken on. A high result indicates that the portfolio has generated return with relatively controlled risk. A low result can indicate that you are taking on too much volatility for the returns you are getting.
Maximum historical drawdown
MaxDD over the TWR series
The worst fall from a peak to a trough across the entire history of your portfolio. It helps you understand how much pain your strategy has put you through in the toughest moments.
Current drawdown
Current fall from highs
It indicates how far below your historical peak you are right now. If it is 0, your portfolio is at all-time highs. If it is negative, it shows the distance left to recover the previous peak.
S&P 500 MaxDD over your period
Benchmark risk
The same maximum-drawdown metric, but applied to the equivalent S&P 500 over your period. This lets you see whether your worst fall was reasonable against the market or whether your portfolio suffered far more.
Win / Loss ratio
Closed trades
It measures what percentage of your closed positions ended in profit. It does not tell the whole story, because a single big trade can weigh more than many small ones, but it helps you review the quality of your entries and exits.
History
Your evolution, day by day. And year by year.
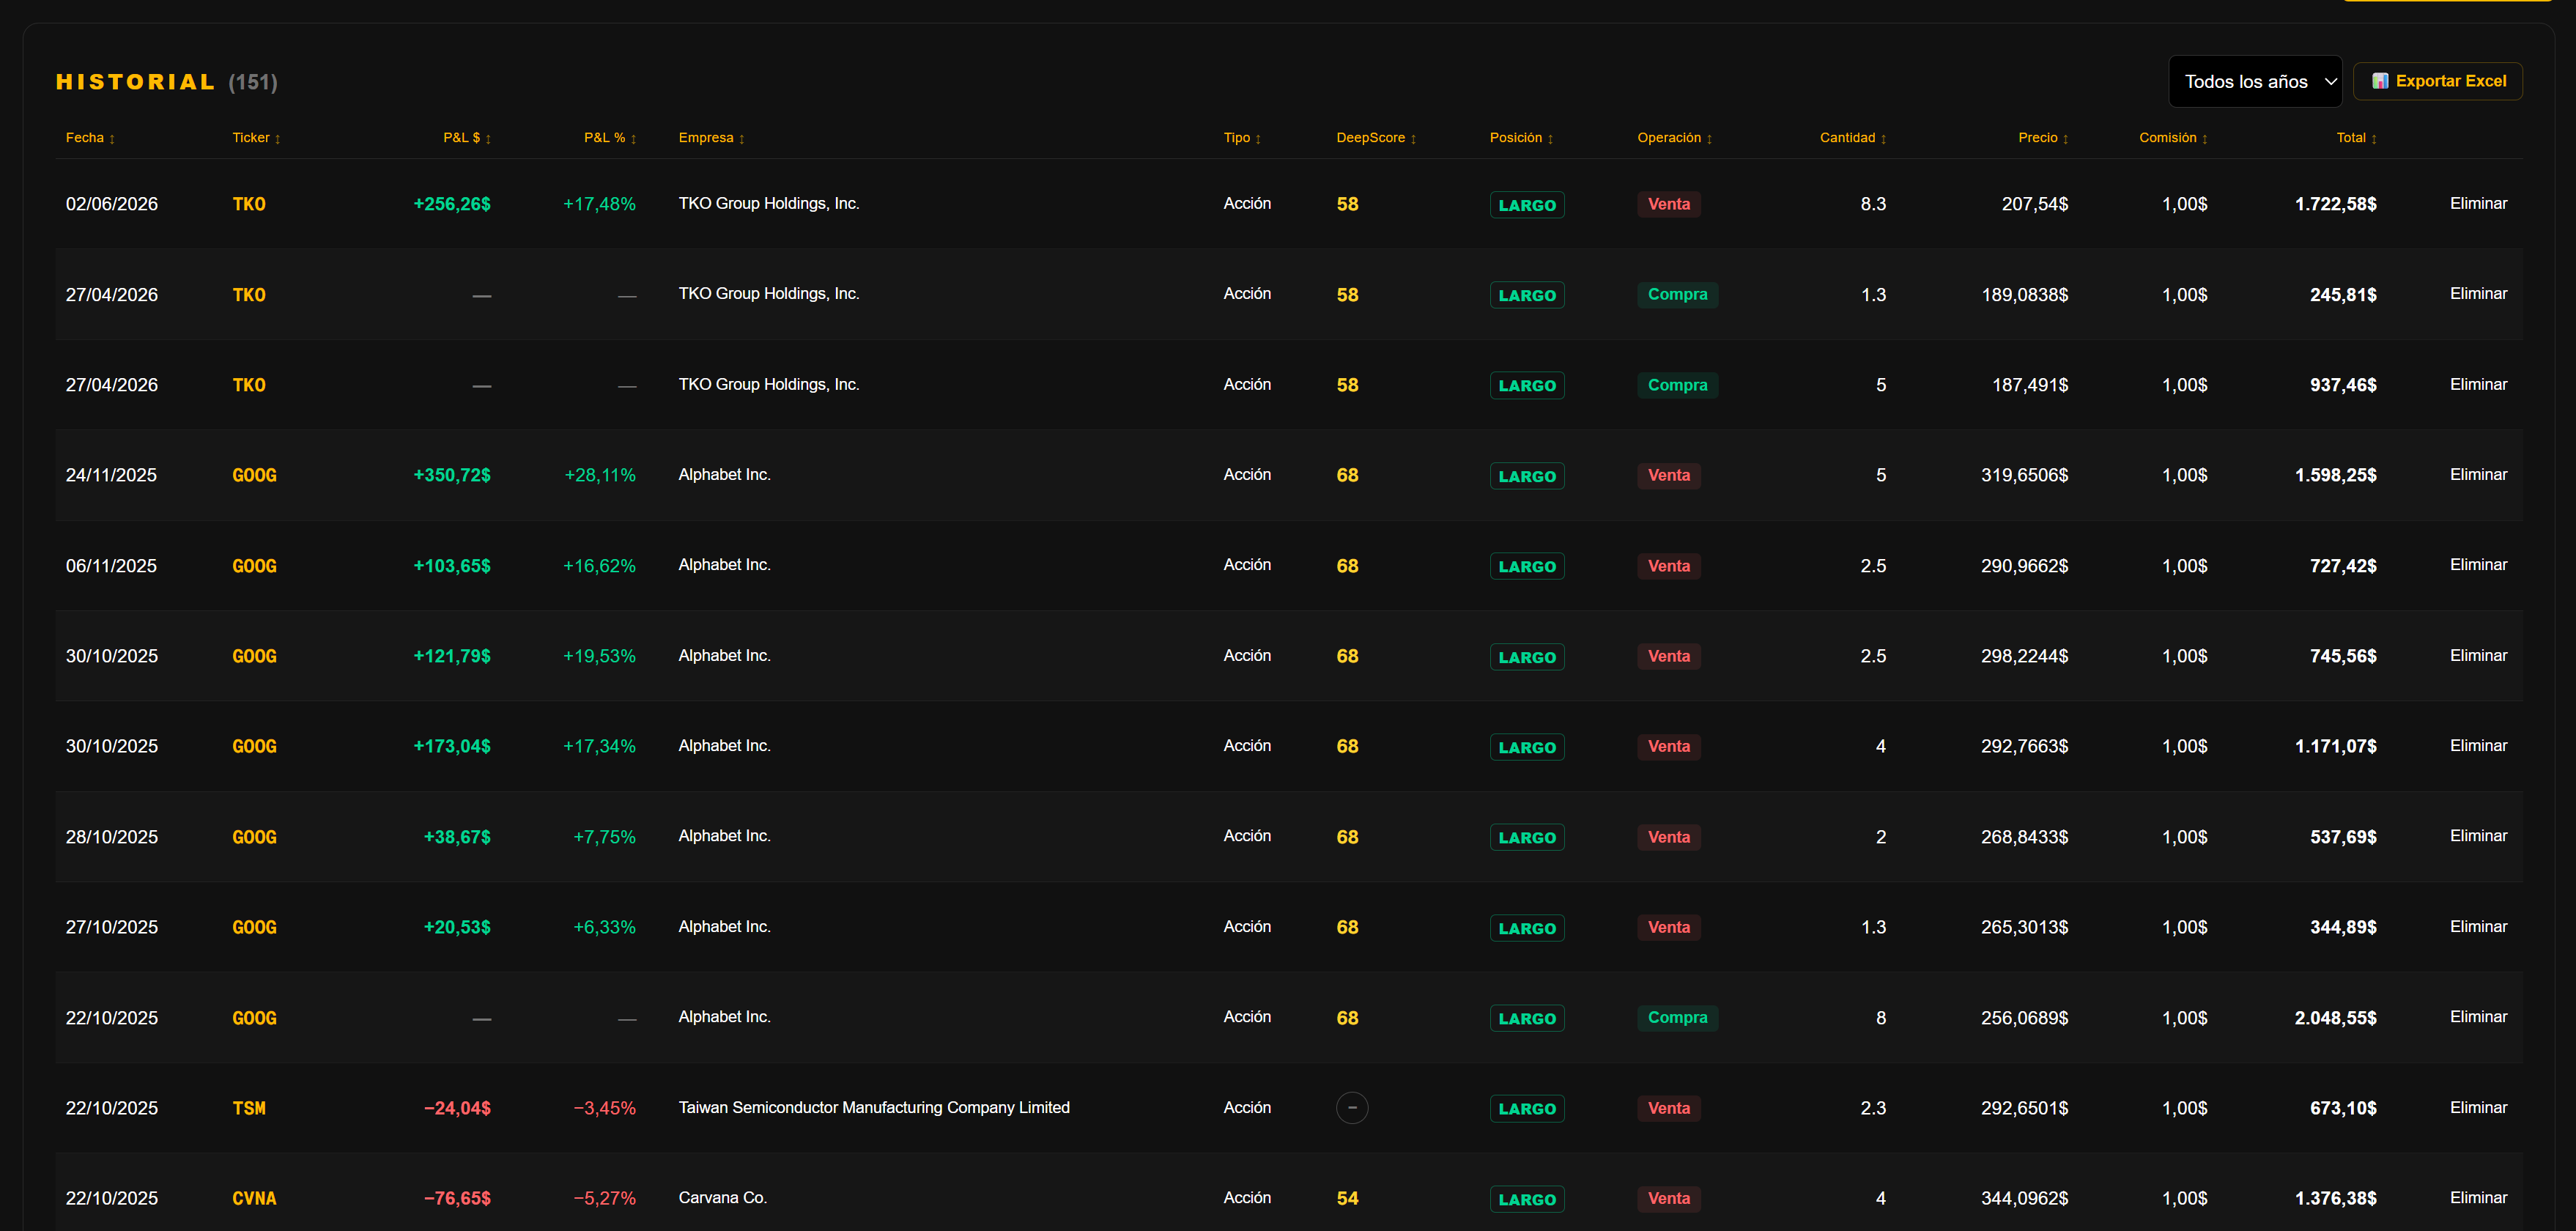
DeepTicker saves automatic snapshots of your portfolio and builds a history so you can see how your investment has evolved over time. You do not just see the current value: you see the whole journey.
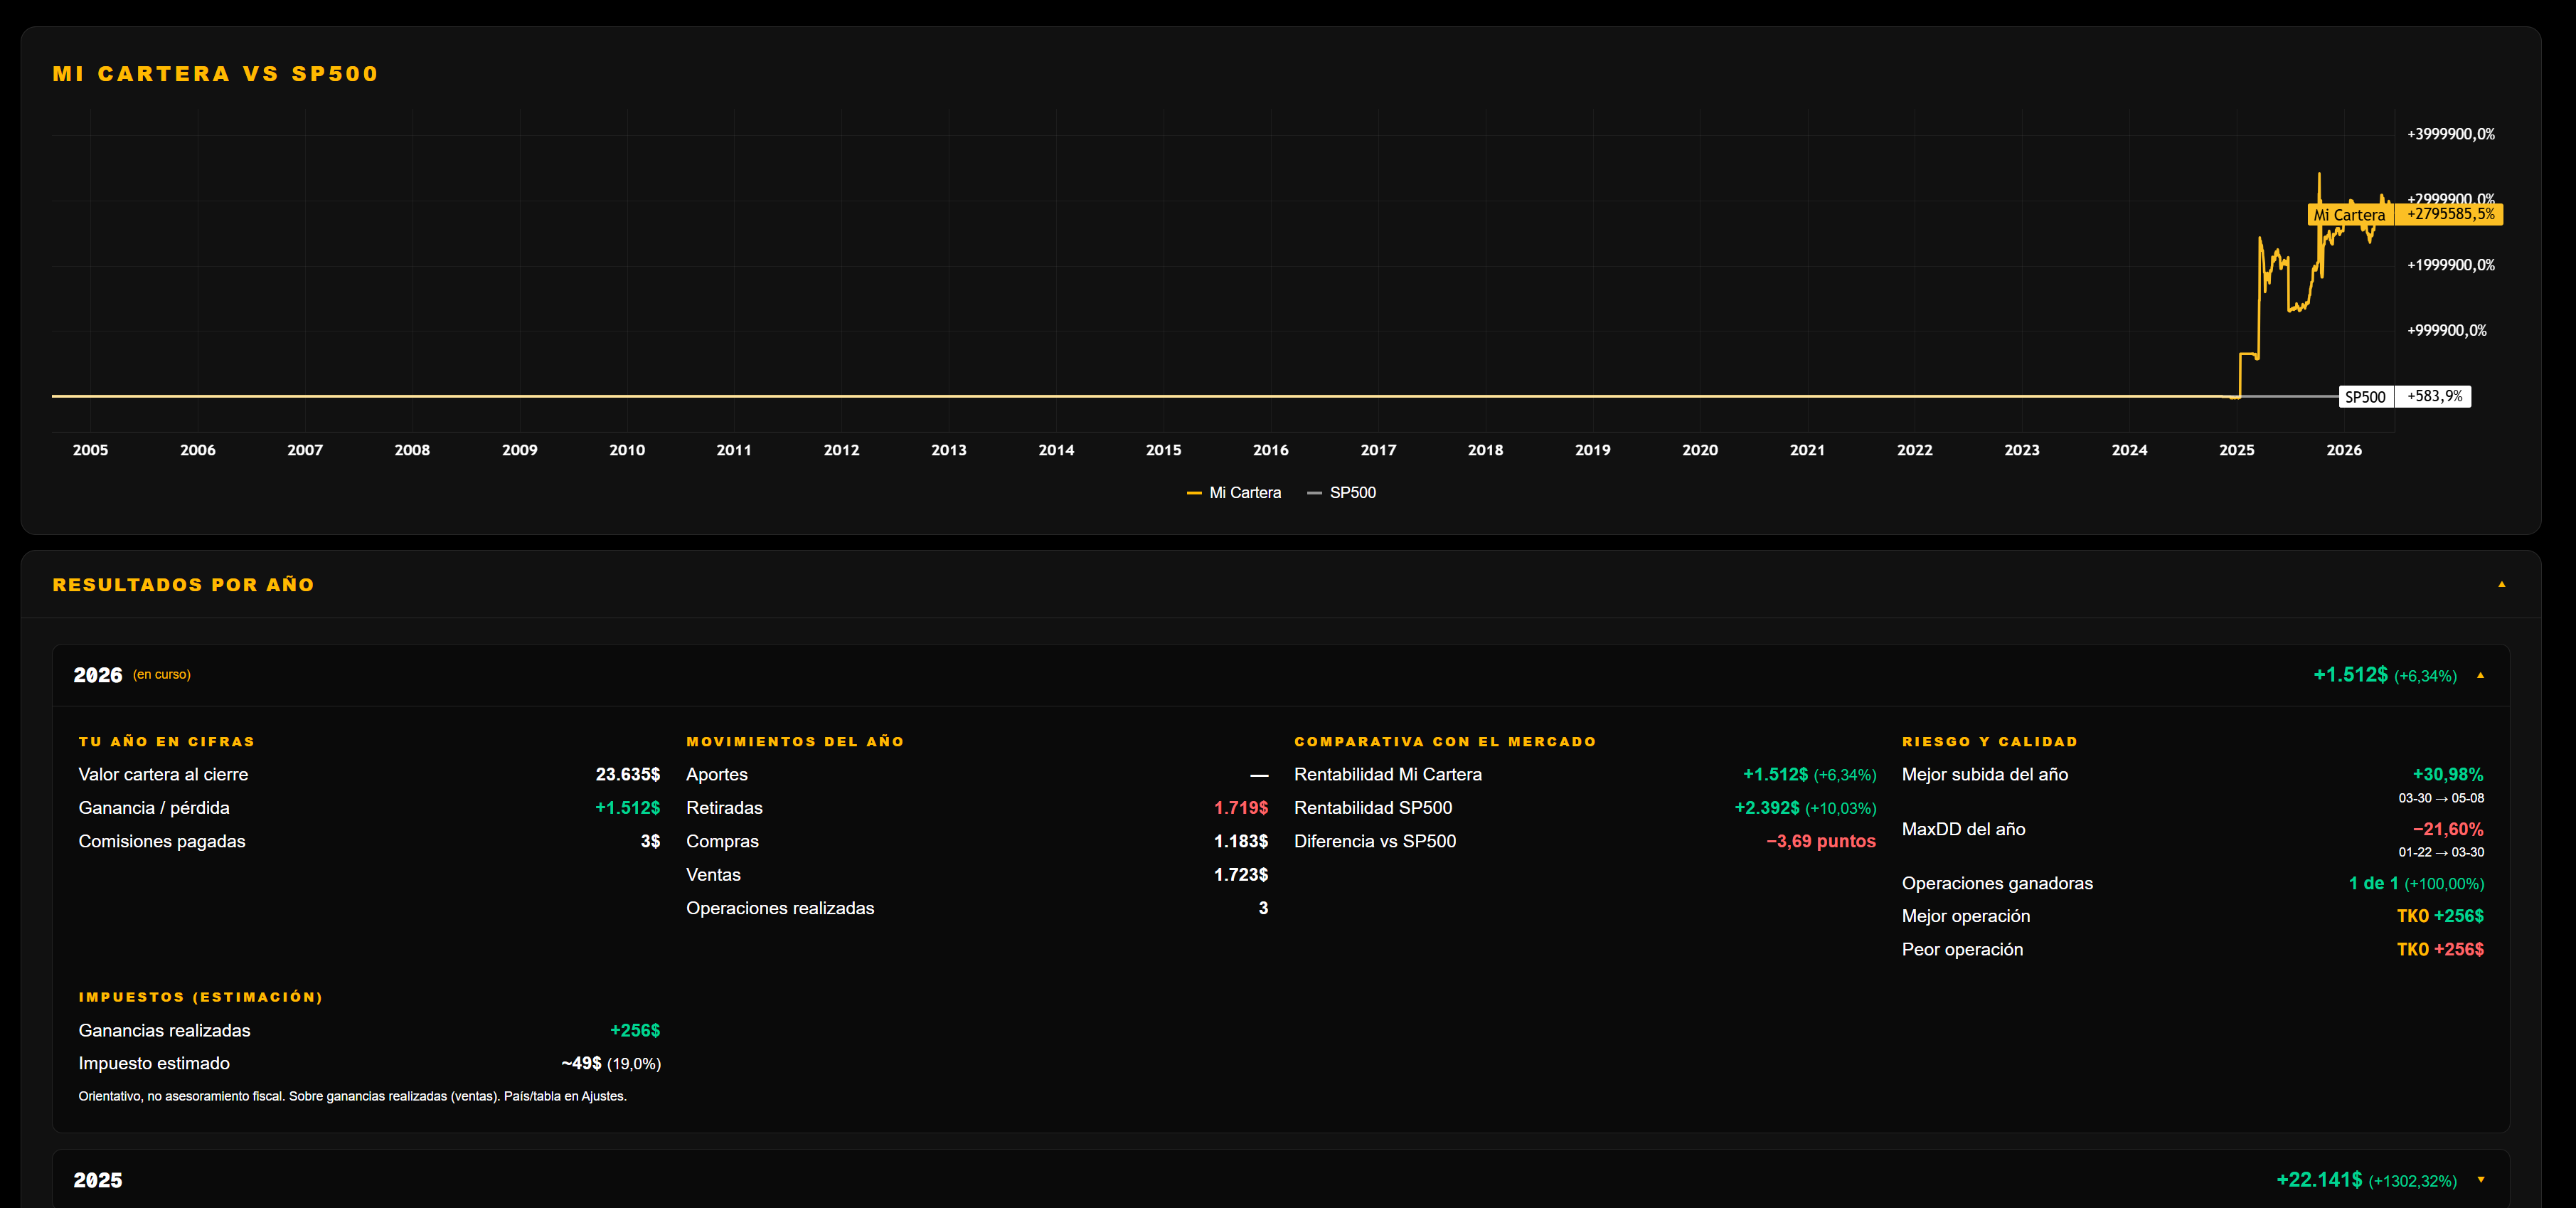
Your portfolio vs the S&P 500, day by day
A performance chart from your first movement, with your portfolio and the SPY simulation using your same cash flows. An honest comparison to see whether your decisions are adding value against the market.
Year-by-year results
An annual breakdown with return, comparison vs the S&P 500, best trade, worst trade, the worst drawdown of the year, number of trades, commissions paid and net deposits or withdrawals.
Automatic daily snapshots
At every market close, DeepTicker saves a snapshot of your portfolio value. You do not have to log in every day or update anything by hand: the history builds itself from your positions and movements.
Tracking
Watch companies without moving money.
The DeepTicker watchlist lets you follow companies before you buy them. You can save tickers, add reference prices, create alerts, write private notes and later review what would have happened if you had bought in when you first started following them.
⭐ Watchlist
Save companies you are interested in without touching your portfolio. Each ticker can keep a reference price from the day you added it, so you can check over time whether your initial idea was on the right track.
🔔 Price alerts
Create alerts above or below a specific price and add a note to remember why that level mattered. When it triggers, it is flagged on your dashboard so you can review it.
📝 Private notes per ticker
A notebook inside each company page. Save your thesis, levels to watch, key dates, questions or ideas. Only you can see those notes, and they save automatically as you type.
💱 EUR/USD converter
If you buy in euros but a trade is in dollars, you can convert currency without leaving DeepTicker. The converter helps you log movements more quickly and consistently.
Start with no money
Not investing yet? Start by simulating.
You do not need money invested to use the simulator. Start with virtual money, test strategies and save the companies you are interested in to a watchlist to follow them before putting in real money.
The simulator helps you build judgment: which companies you watch, the price that caught your eye, what happened next and which signals you should have looked at more closely.
Start simulating your portfolio today.
The Stock Market Simulator is free forever. And when you sign up you unlock 14 days of full Premium to try the Stock Screener, the Market Dashboard, the news and DeepTicker's advanced analysis too. No card, no commitment.
Frequently asked questions
Common questions about the stock market simulator
What is a stock market simulator?
A stock market simulator lets you invest with virtual money and real market prices to learn and test strategies without risking your capital. In DeepTicker you can also replicate your real broker portfolio and analyze it with professional metrics. You log the movements (buys, sells, deposits, withdrawals) and the platform computes value, return, risk and a comparison against the market.
Is the simulator free?
Yes. The Stock Market Simulator is free forever, with no card required. Even if you never activate Premium, you can keep using it. When you sign up you also unlock 14 days of full Premium to try the rest of DeepTicker.
Which markets can I simulate?
You can add stocks and ETFs from the world’s main exchanges: the US, Spain, the UK, Canada, Australia, Europe and China, among others. DeepTicker detects the native currency (EUR, GBP, etc.), converts it to dollars at the day’s FX rate and computes everything in USD so your return never gets out of sync.
Do I have to use virtual money or can I replicate my real portfolio?
Both. You can start from scratch with virtual money to learn and test strategies, or record your real broker portfolio to analyze it with far more metrics than your broker gives you. It works the same way: you log the movements and the platform does the maths.
Do I need to connect my broker?
No. DeepTicker does not need access to your brokerage account or your passwords. You log the movements by hand (ticker, type, quantity, price, date and commission) and the simulator builds the full return and risk picture. That keeps your data private.
How do I know if my portfolio beats the market?
DeepTicker works out your alpha vs an equivalent S&P 500: it simulates what would have happened if you had invested the same money in SPY, on the same dates and with the same deposits and withdrawals. That gives you a fair read on whether your decisions add value against the market.
What is the difference between money gain and TWR?
Money gain measures the real money you have made or lost. TWR measures the portfolio return while isolating the effect of when you added or withdrew money. That is why you can have a positive money gain and a more modest TWR, or the other way around.
Is the simulator the same as the Competition?
No. The Stock Market Simulator is your personal space to practice or track your own portfolio, with metrics like TWR, Sharpe ratio, drawdown and alpha vs the S&P 500. The Competition is a public contest with a ranking, prizes and Alpha DeepTicker (a reputation score only calculated in the Competition).